Art Statistics
2016–2017
The data presented here was produced by the Arts in NYC course taught at CUNY Guttman College by James Case-Leal Spring 2017.
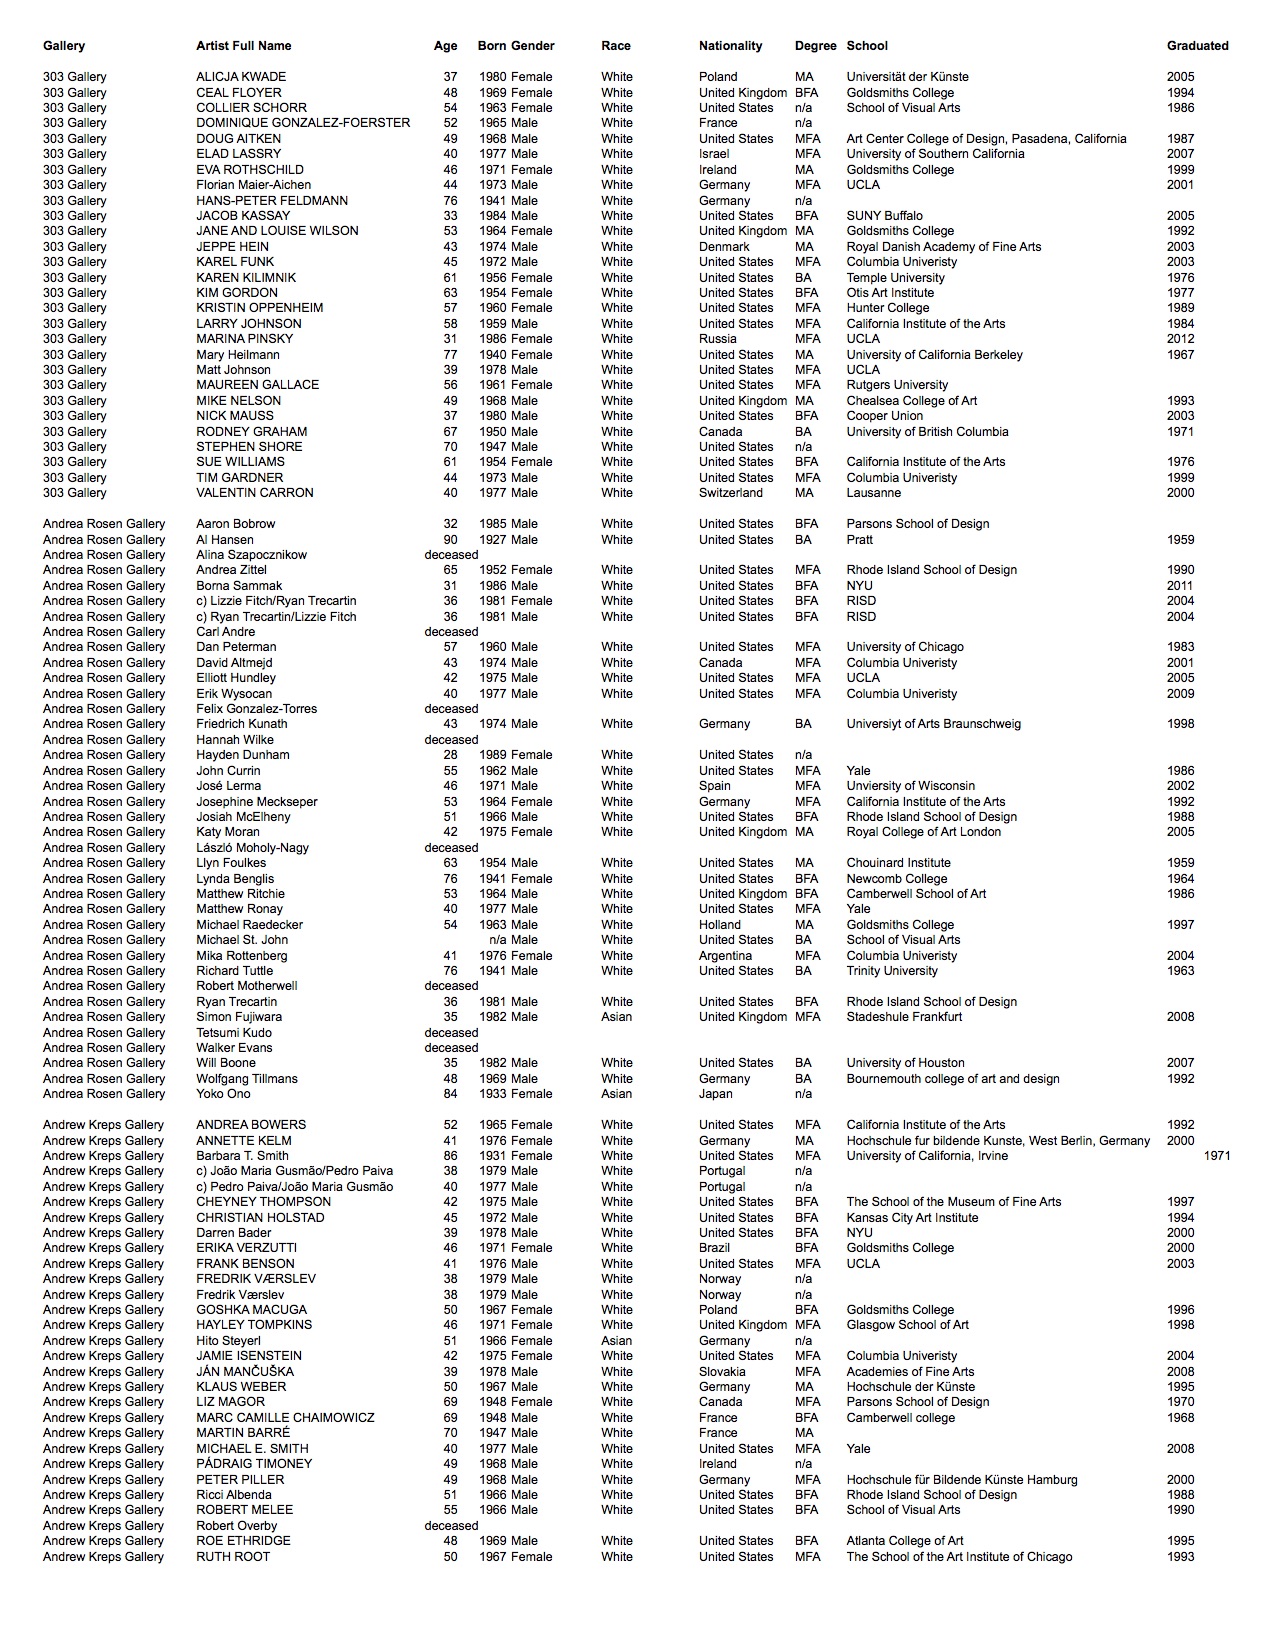
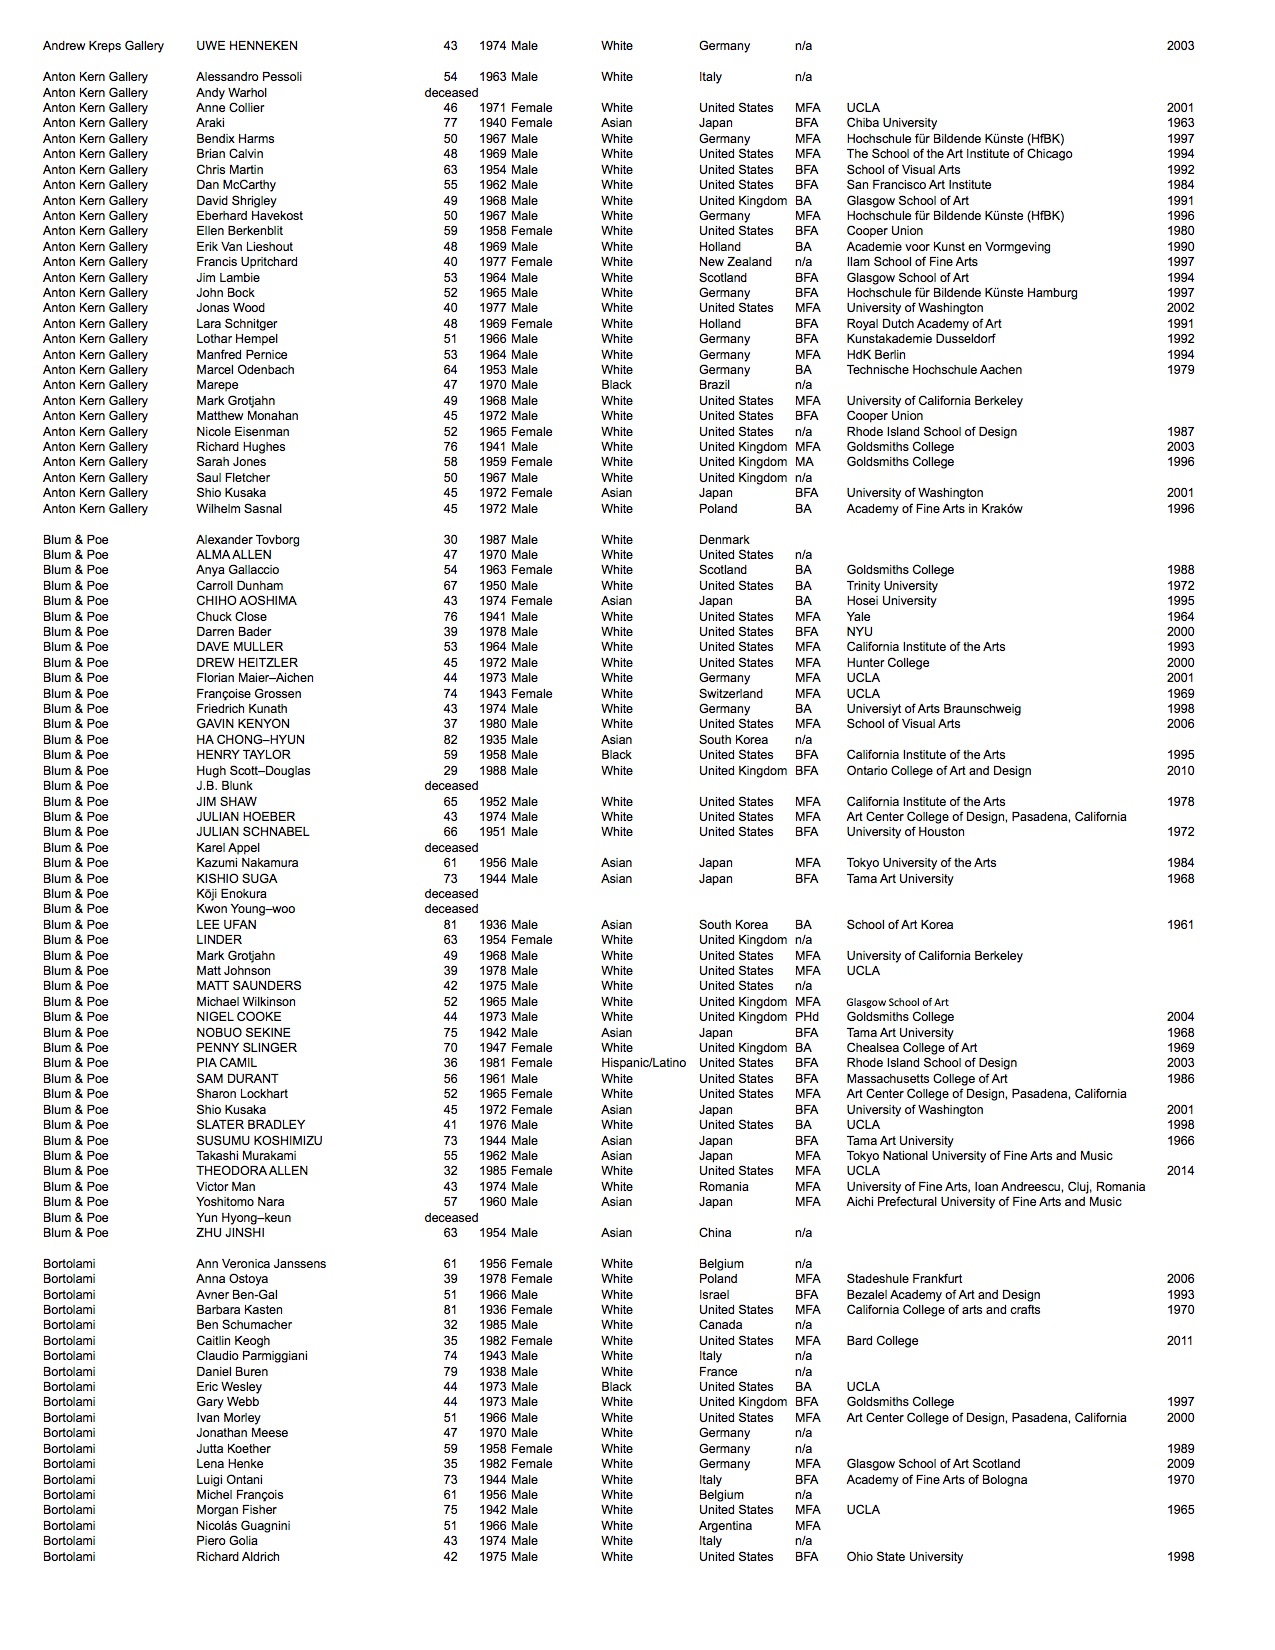
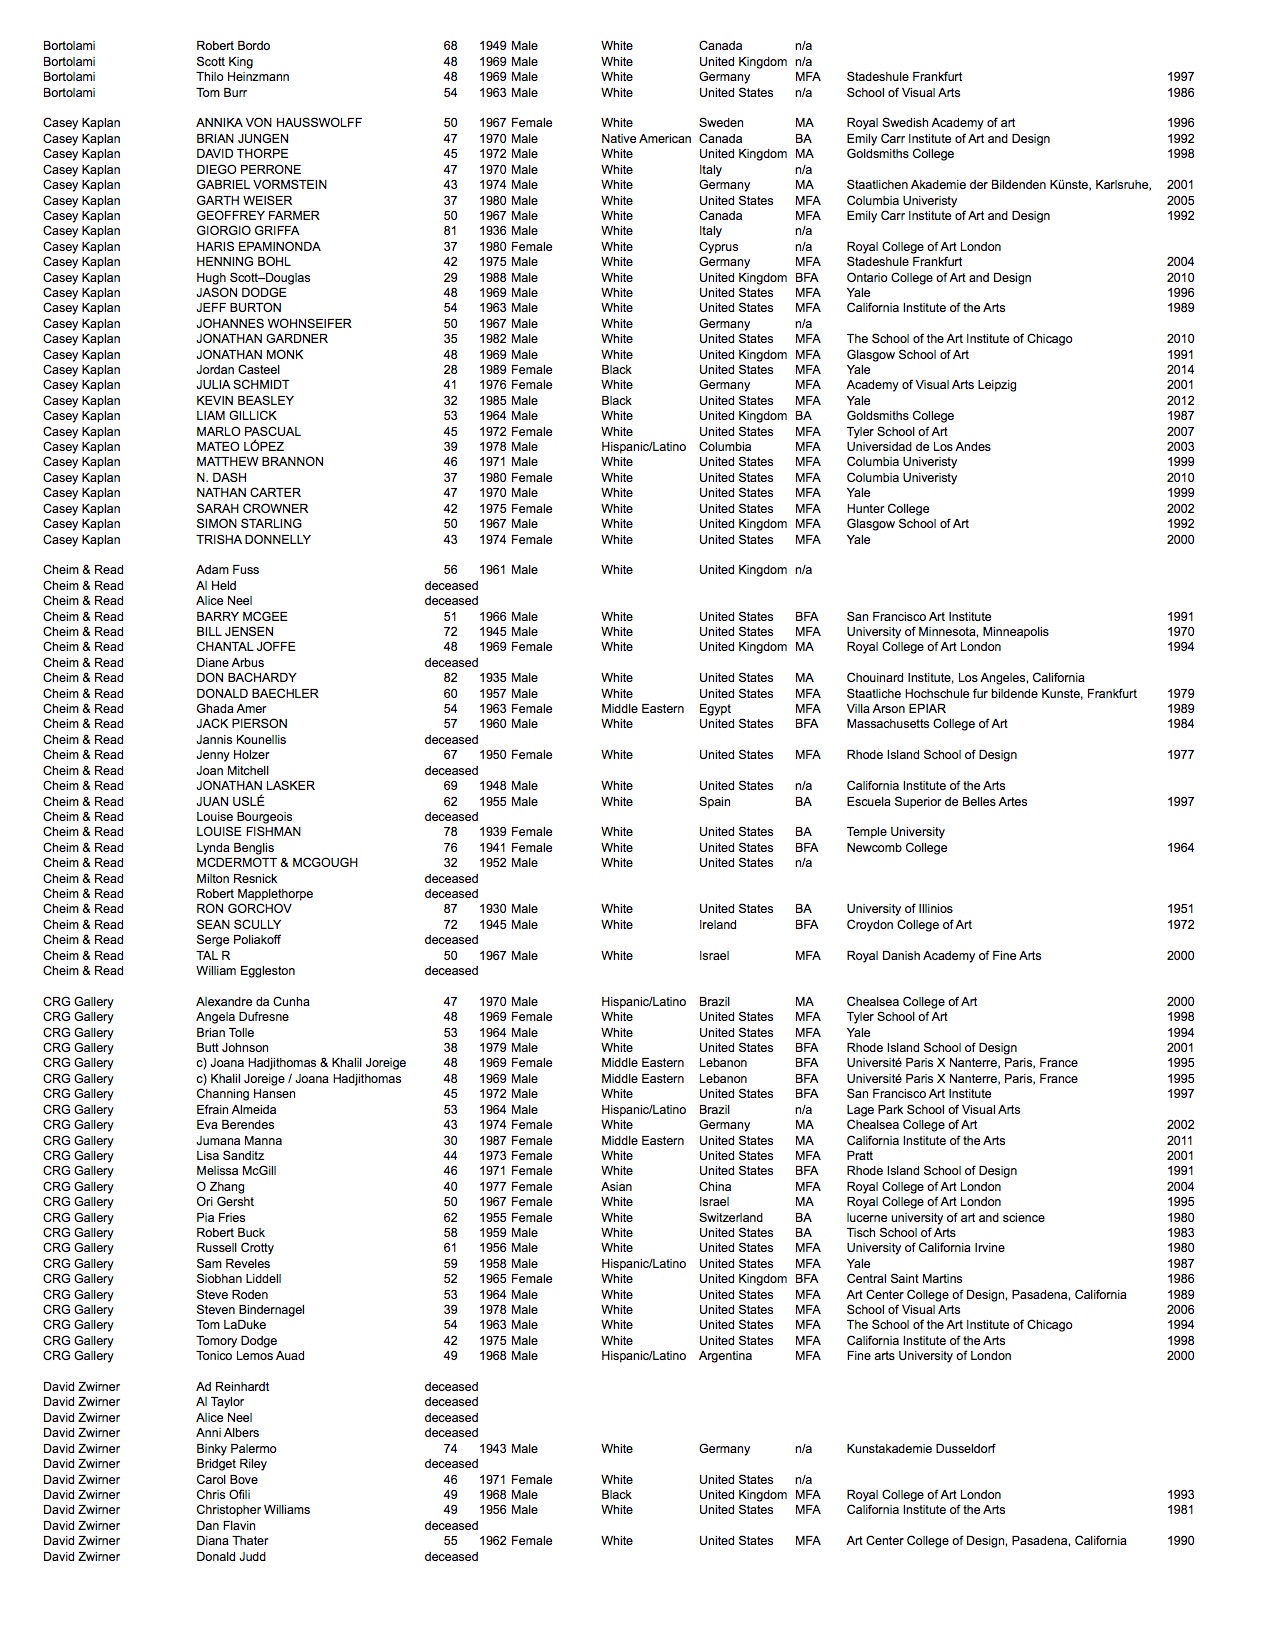
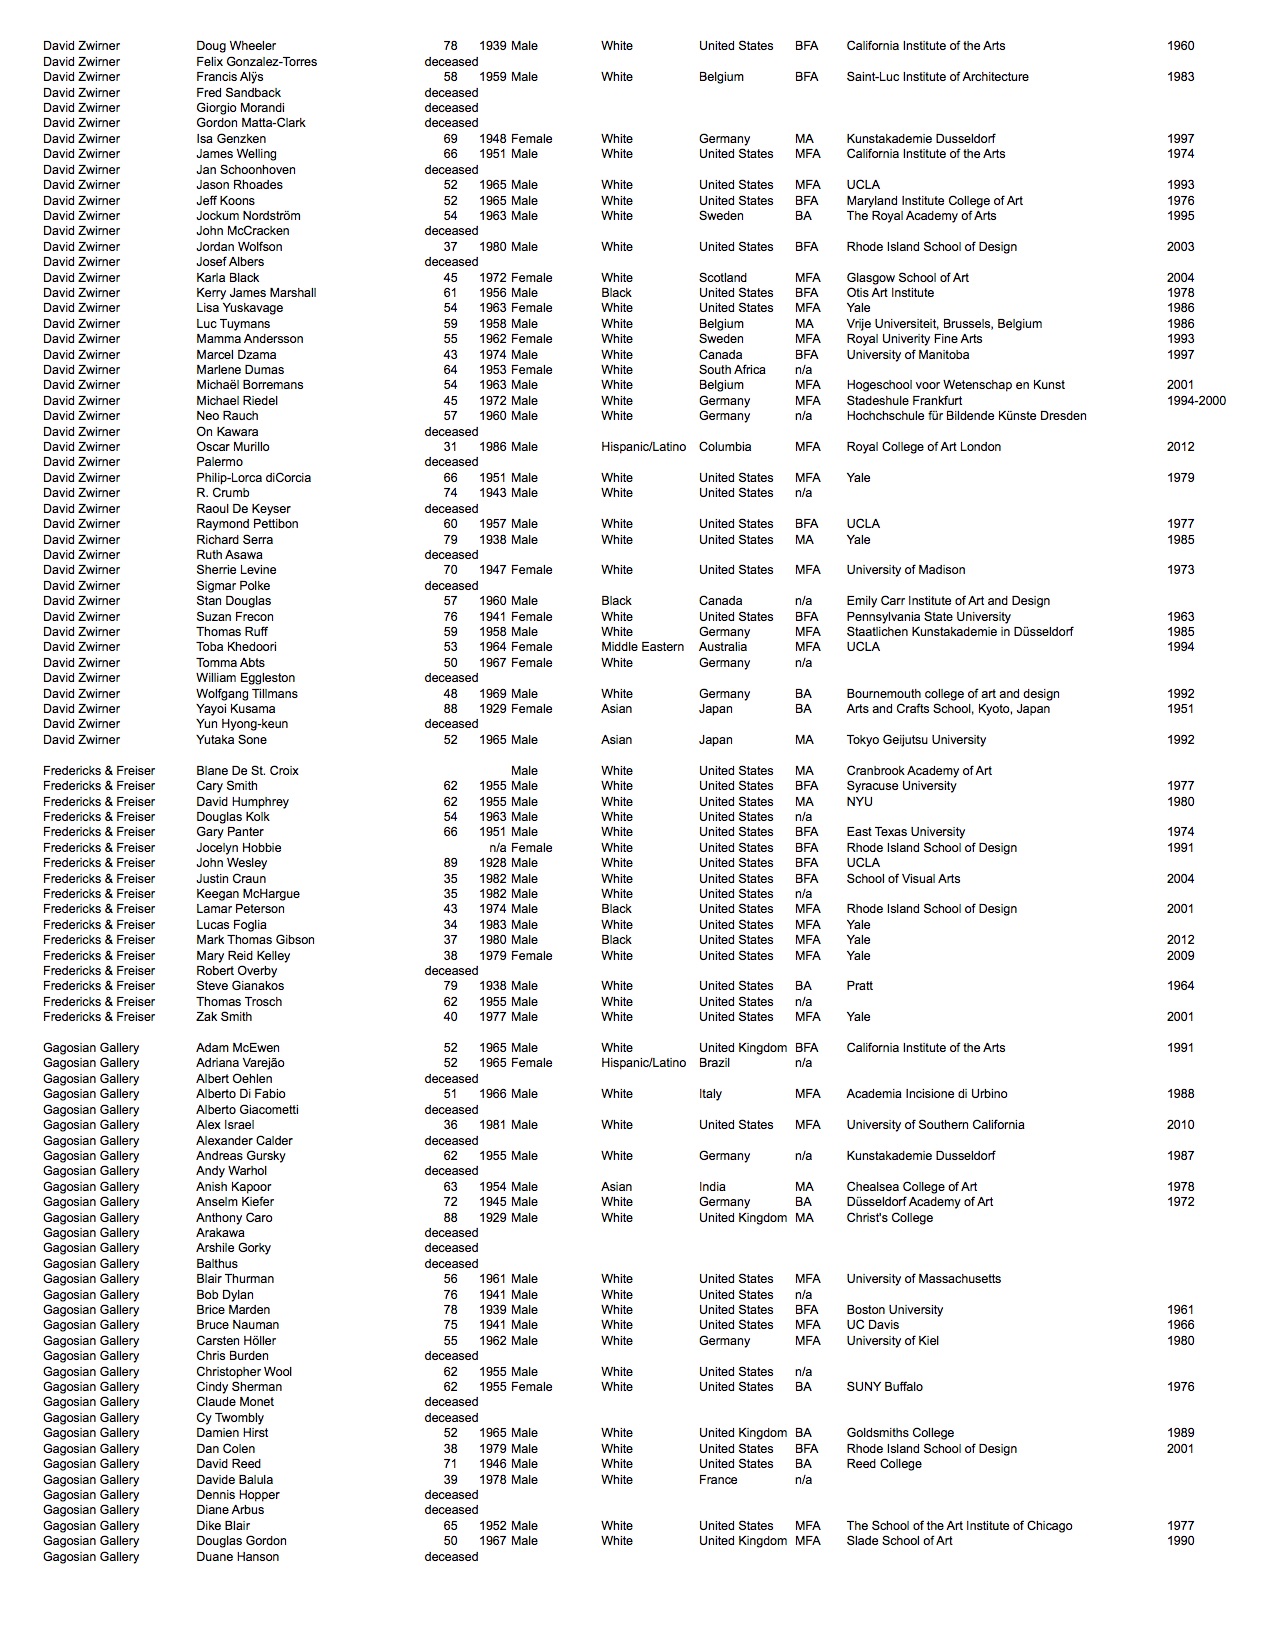
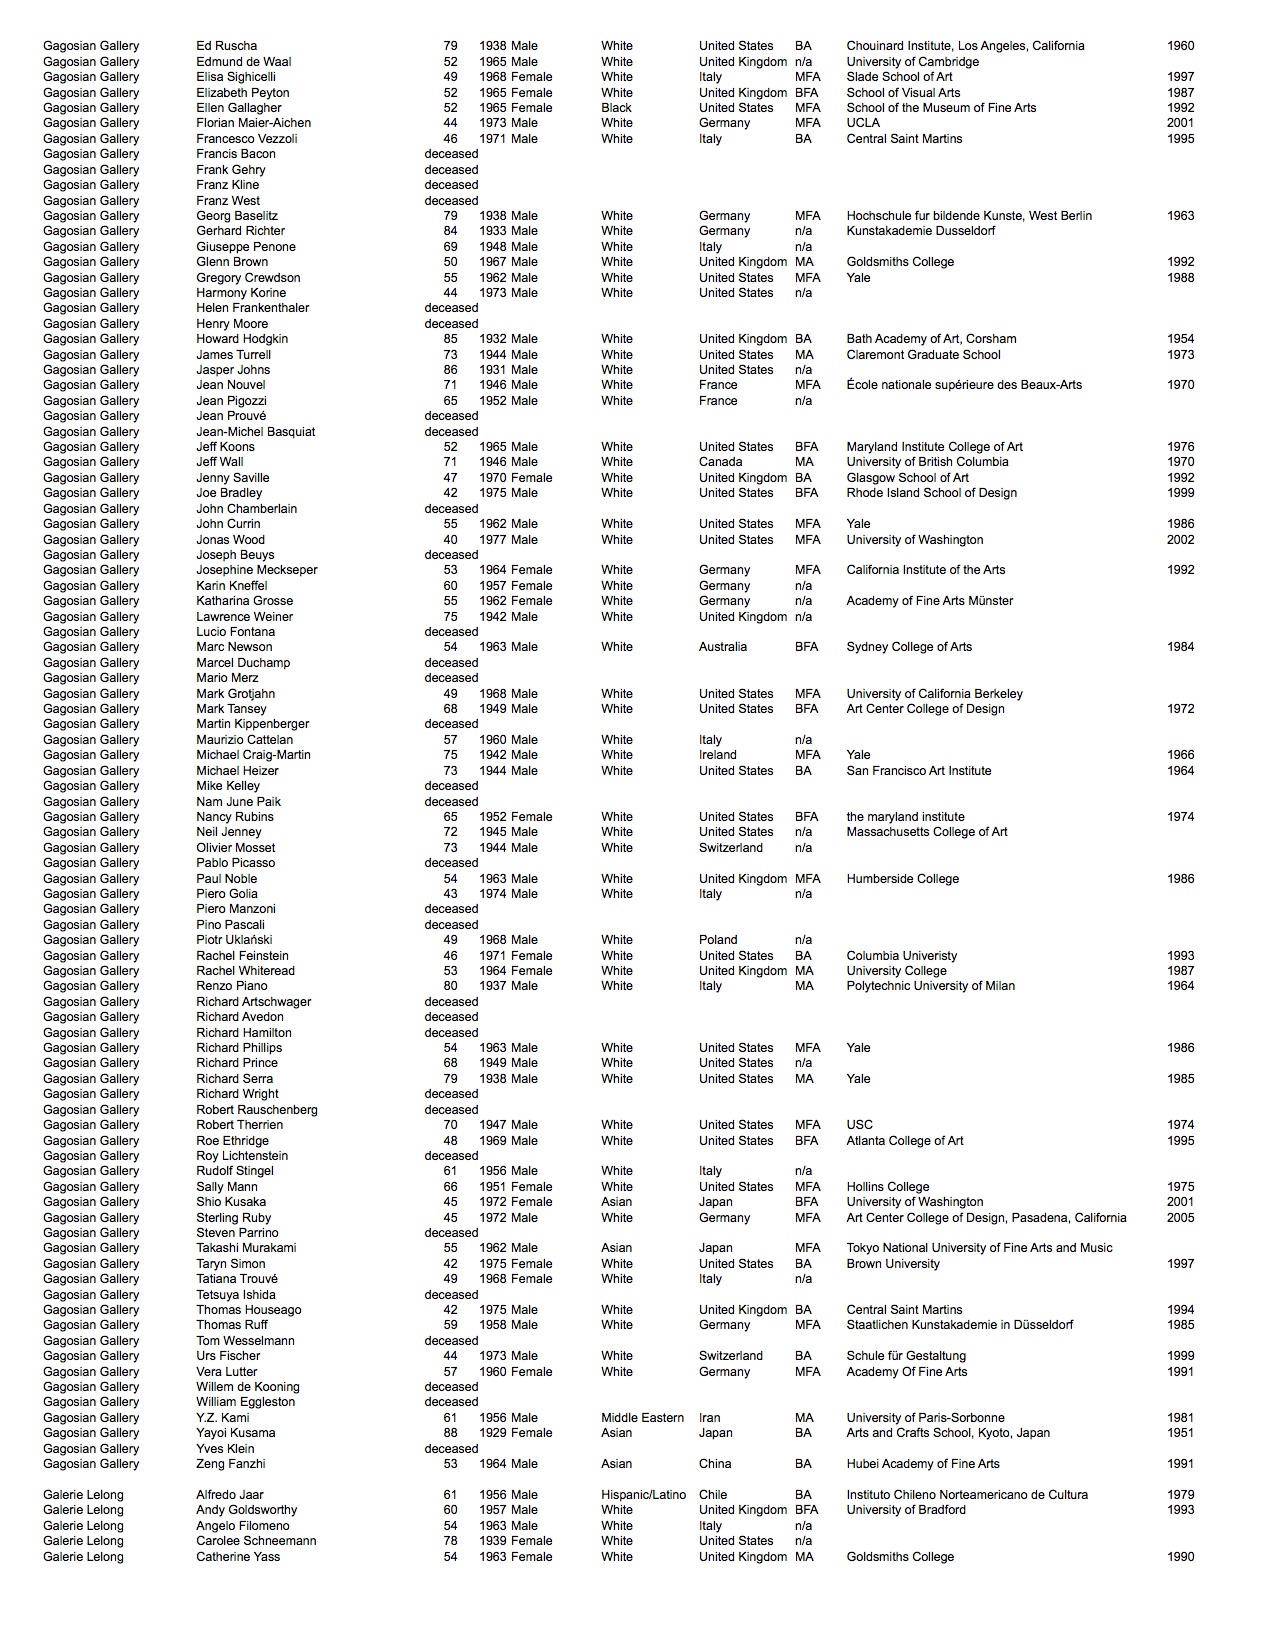
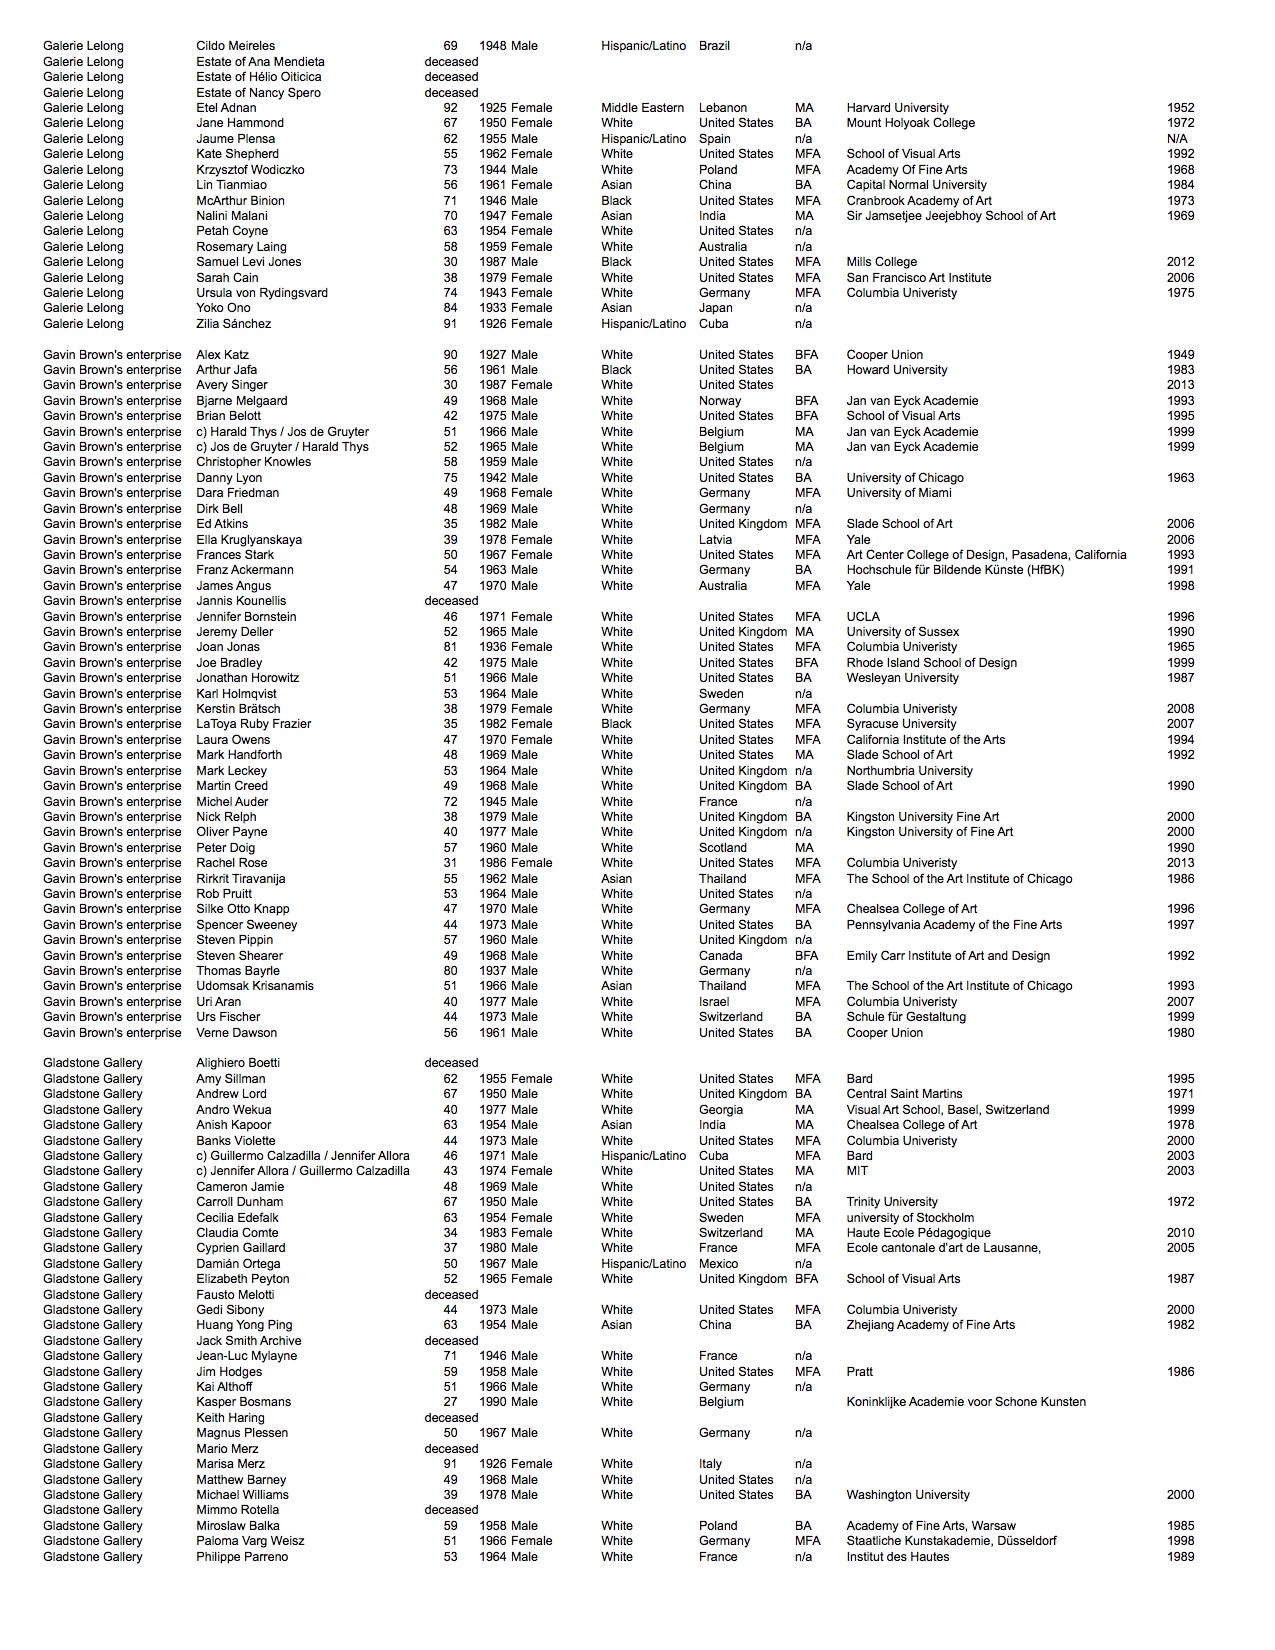
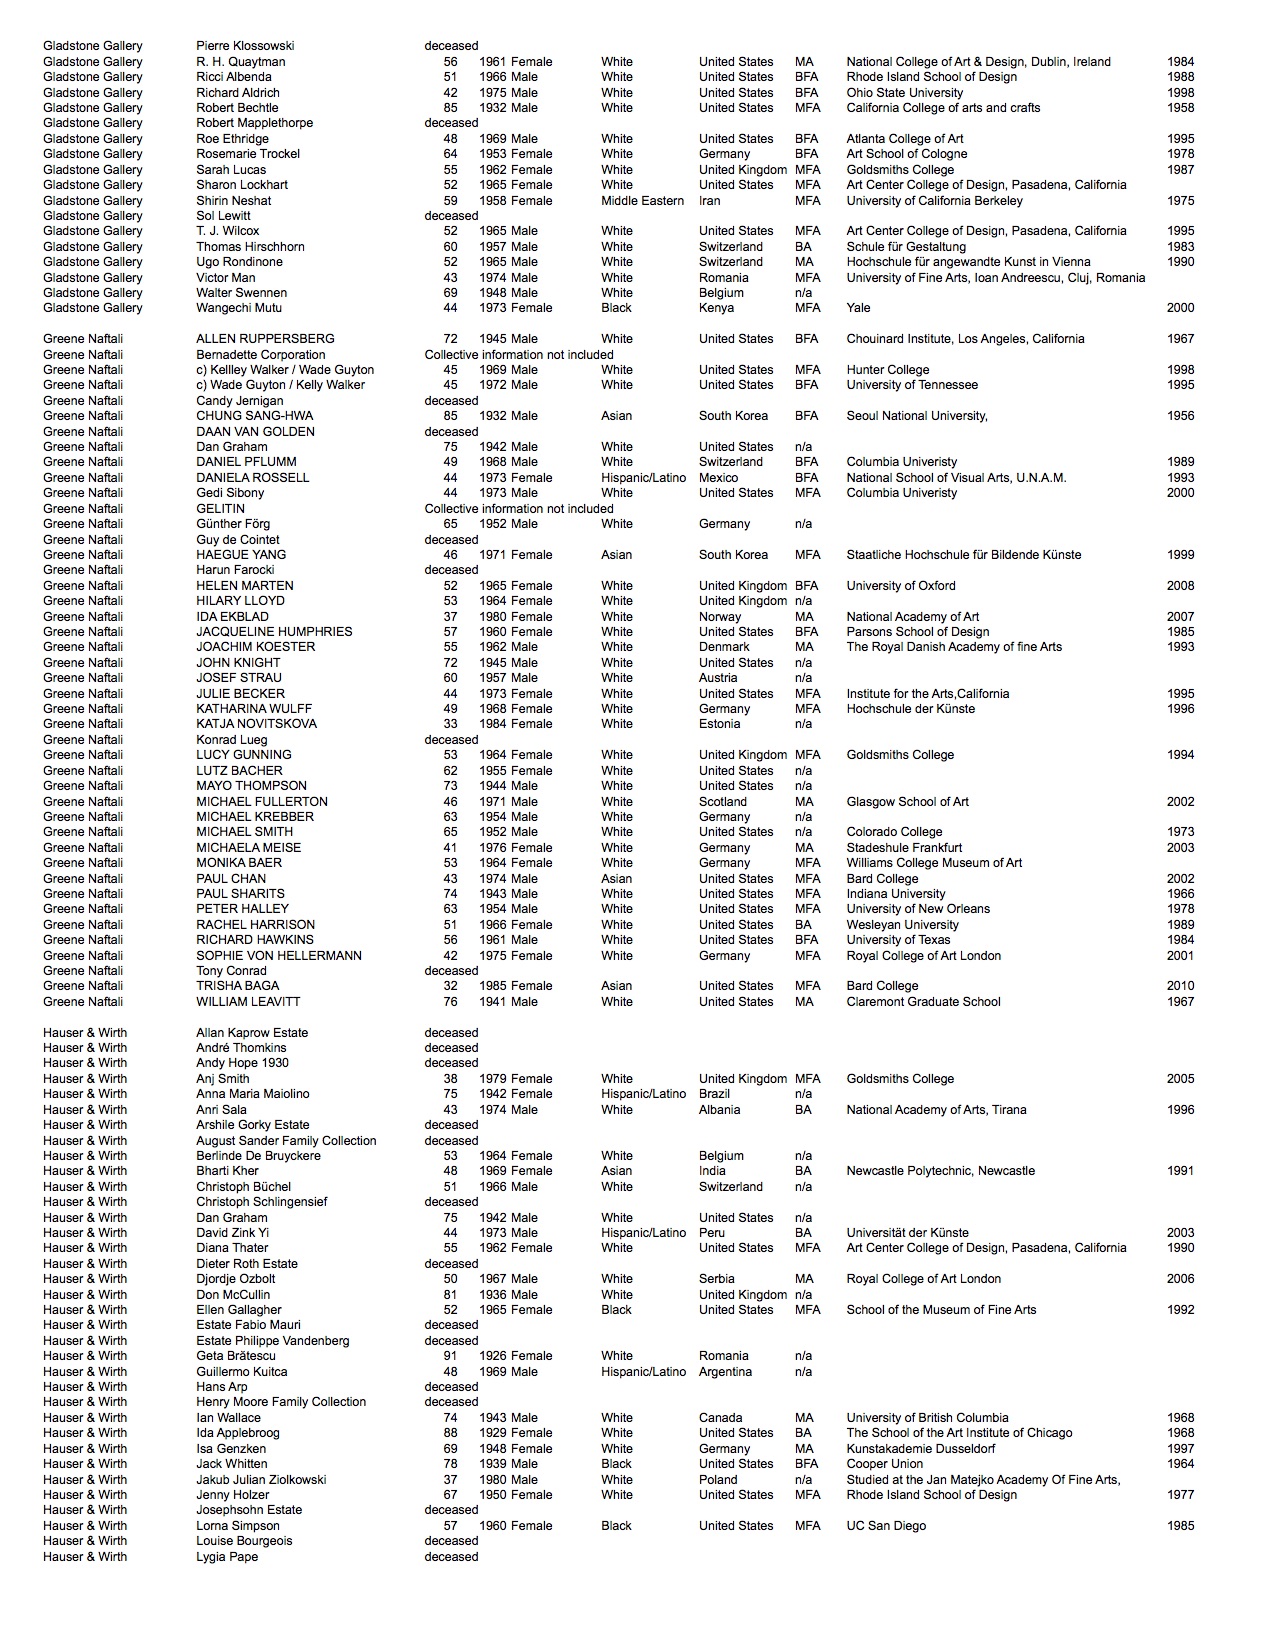
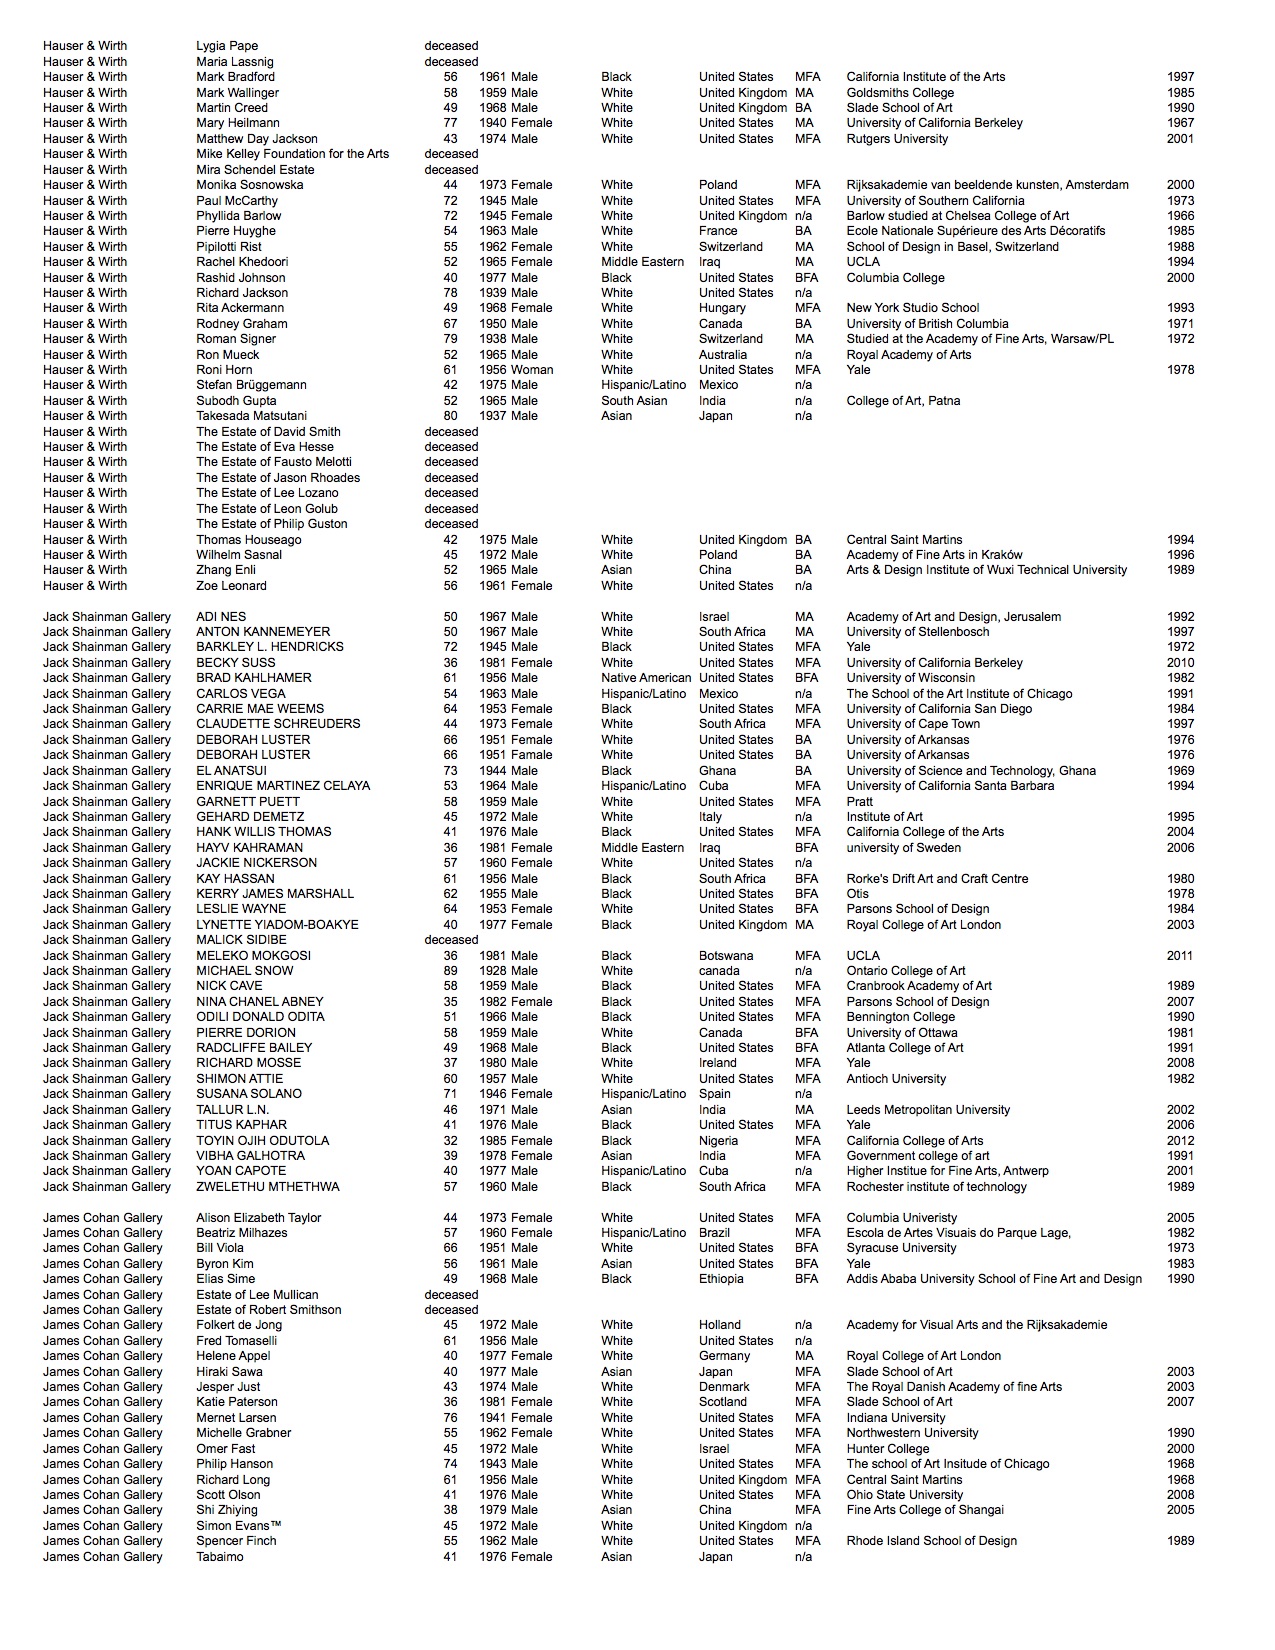
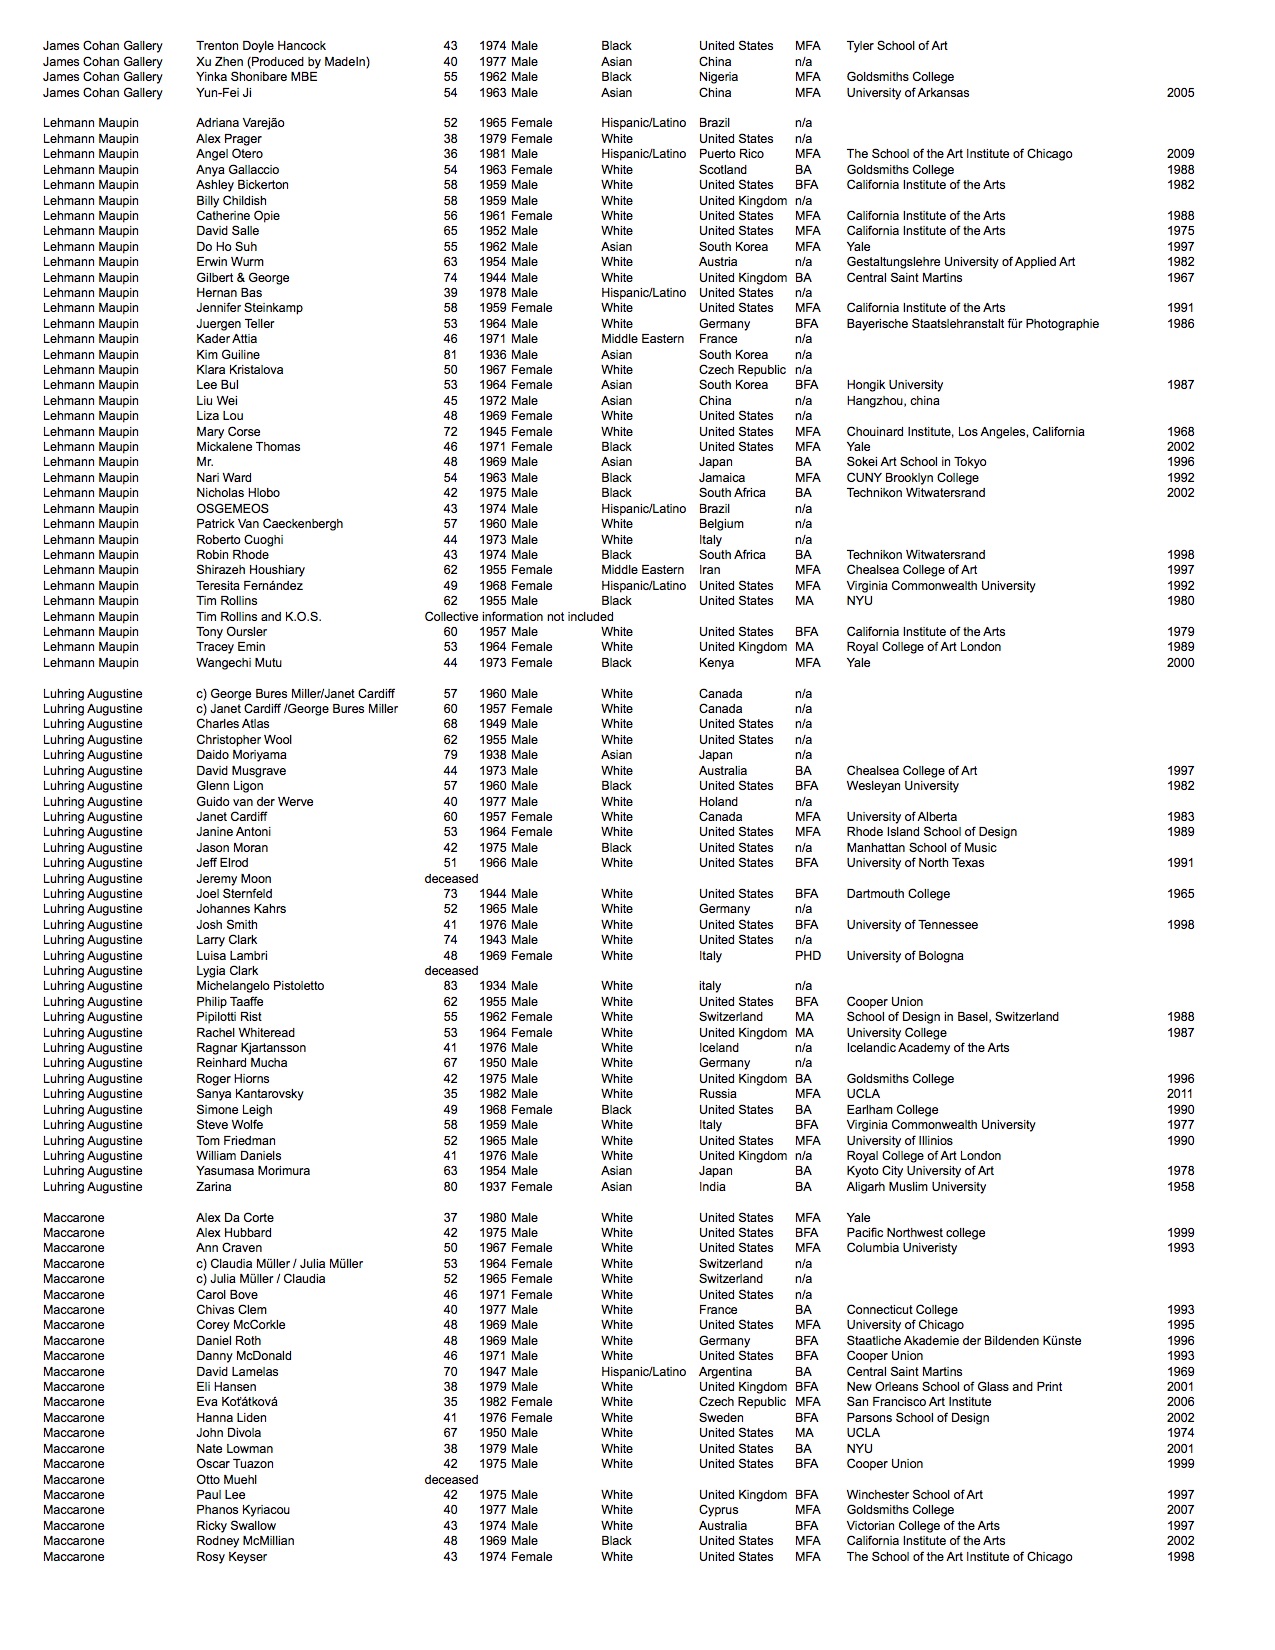
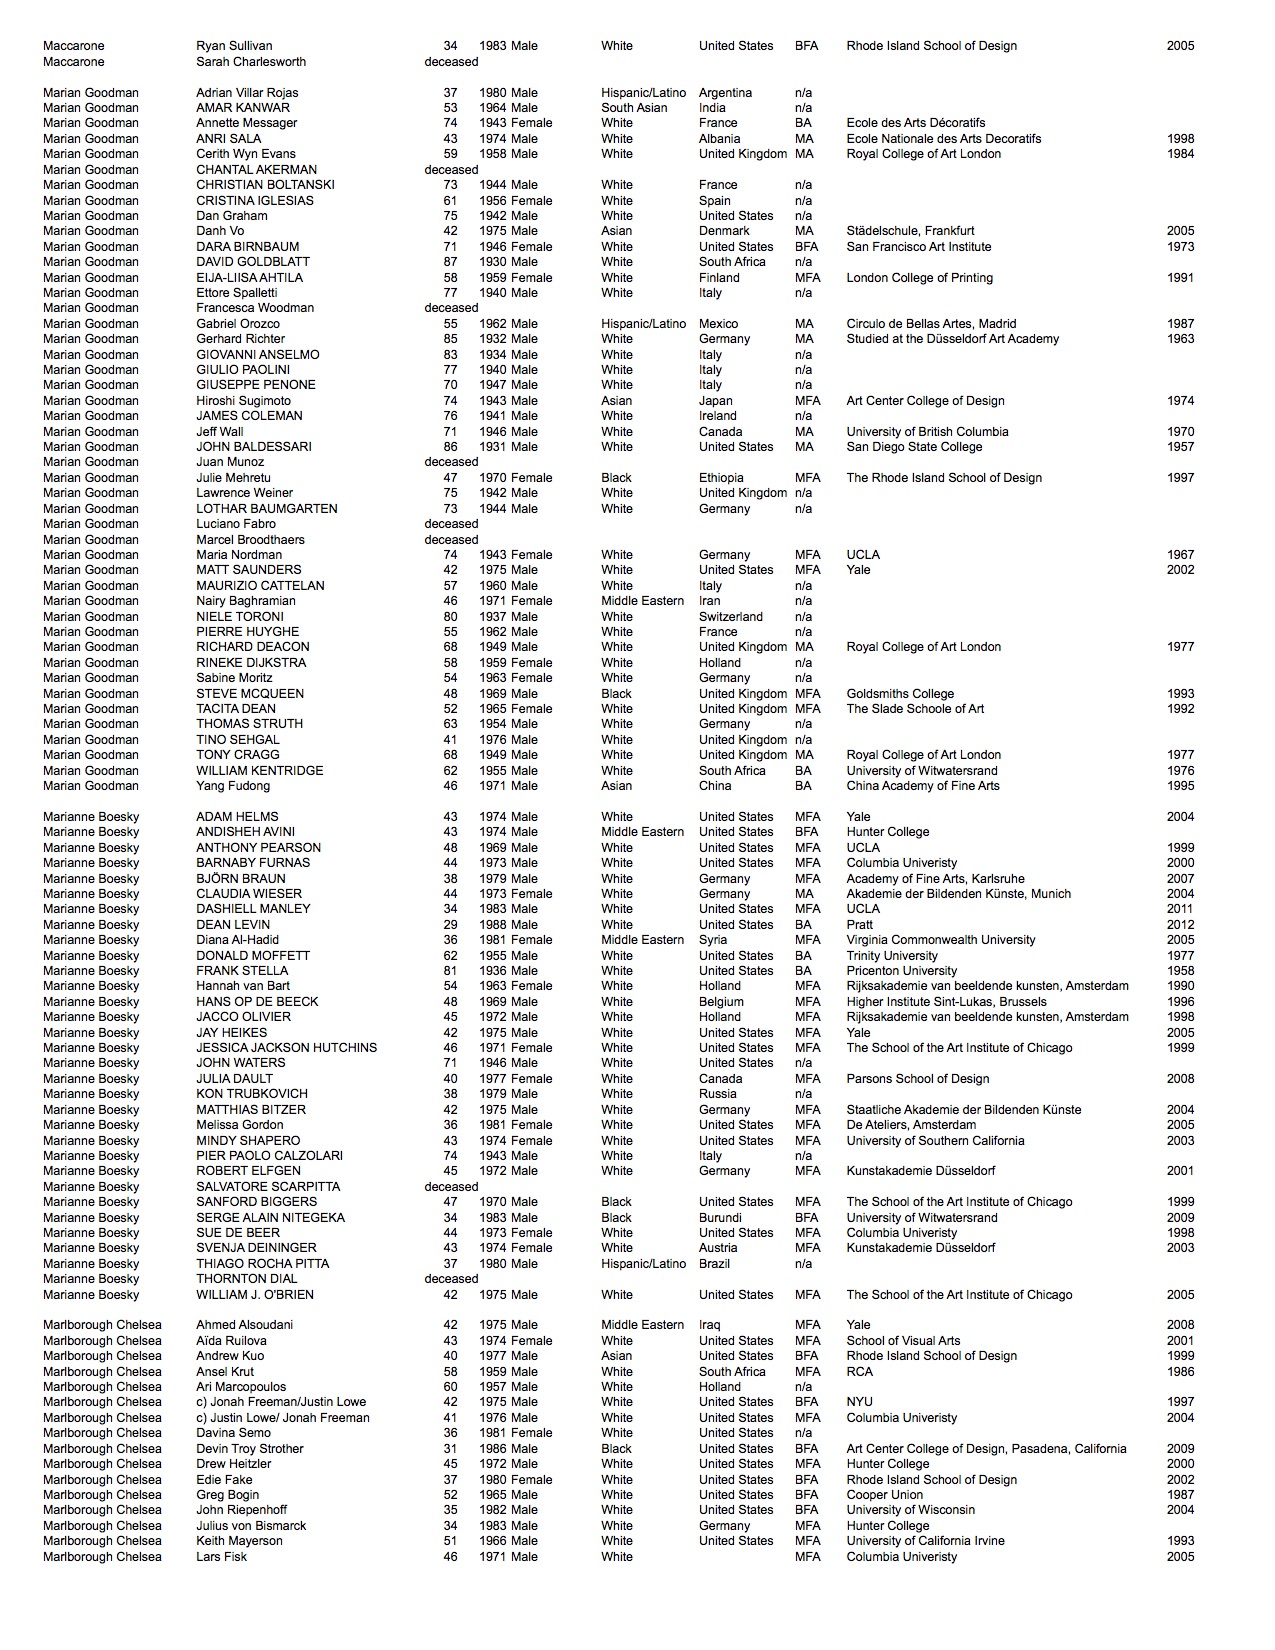
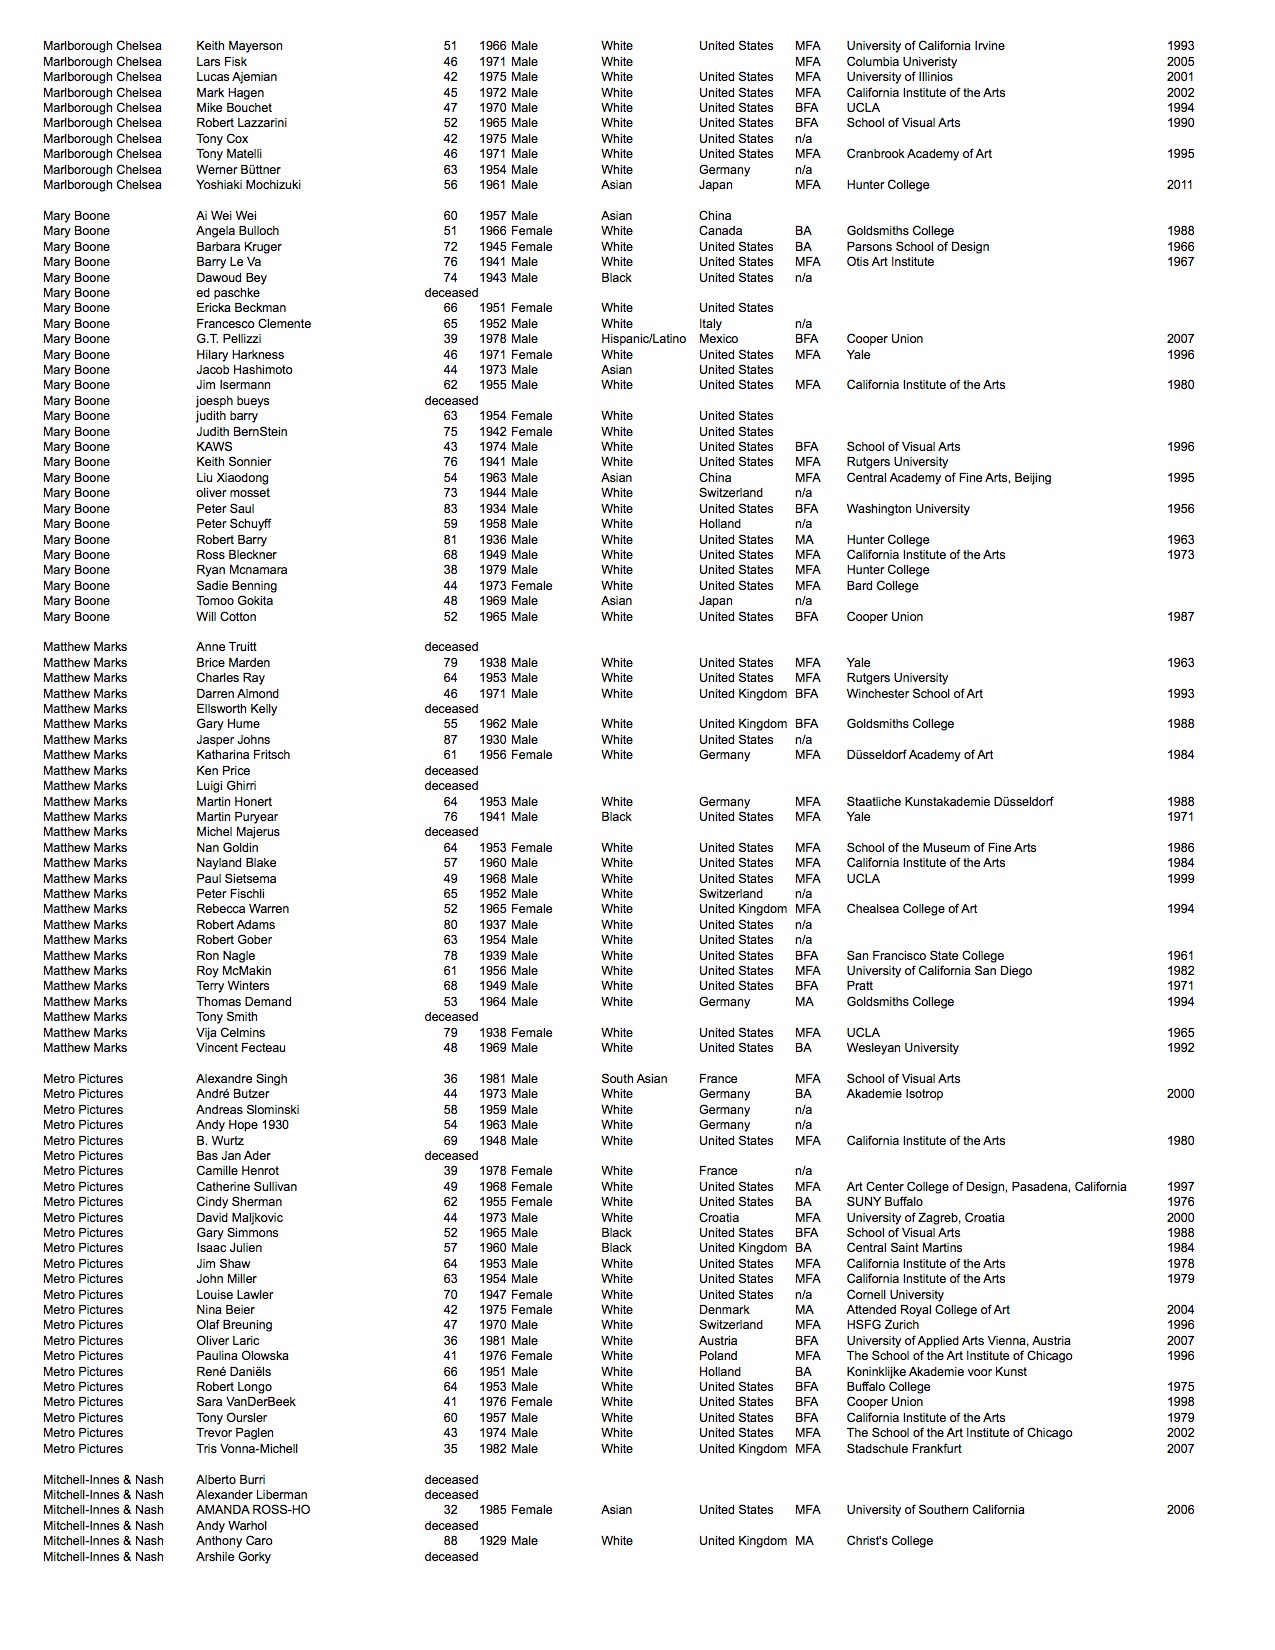
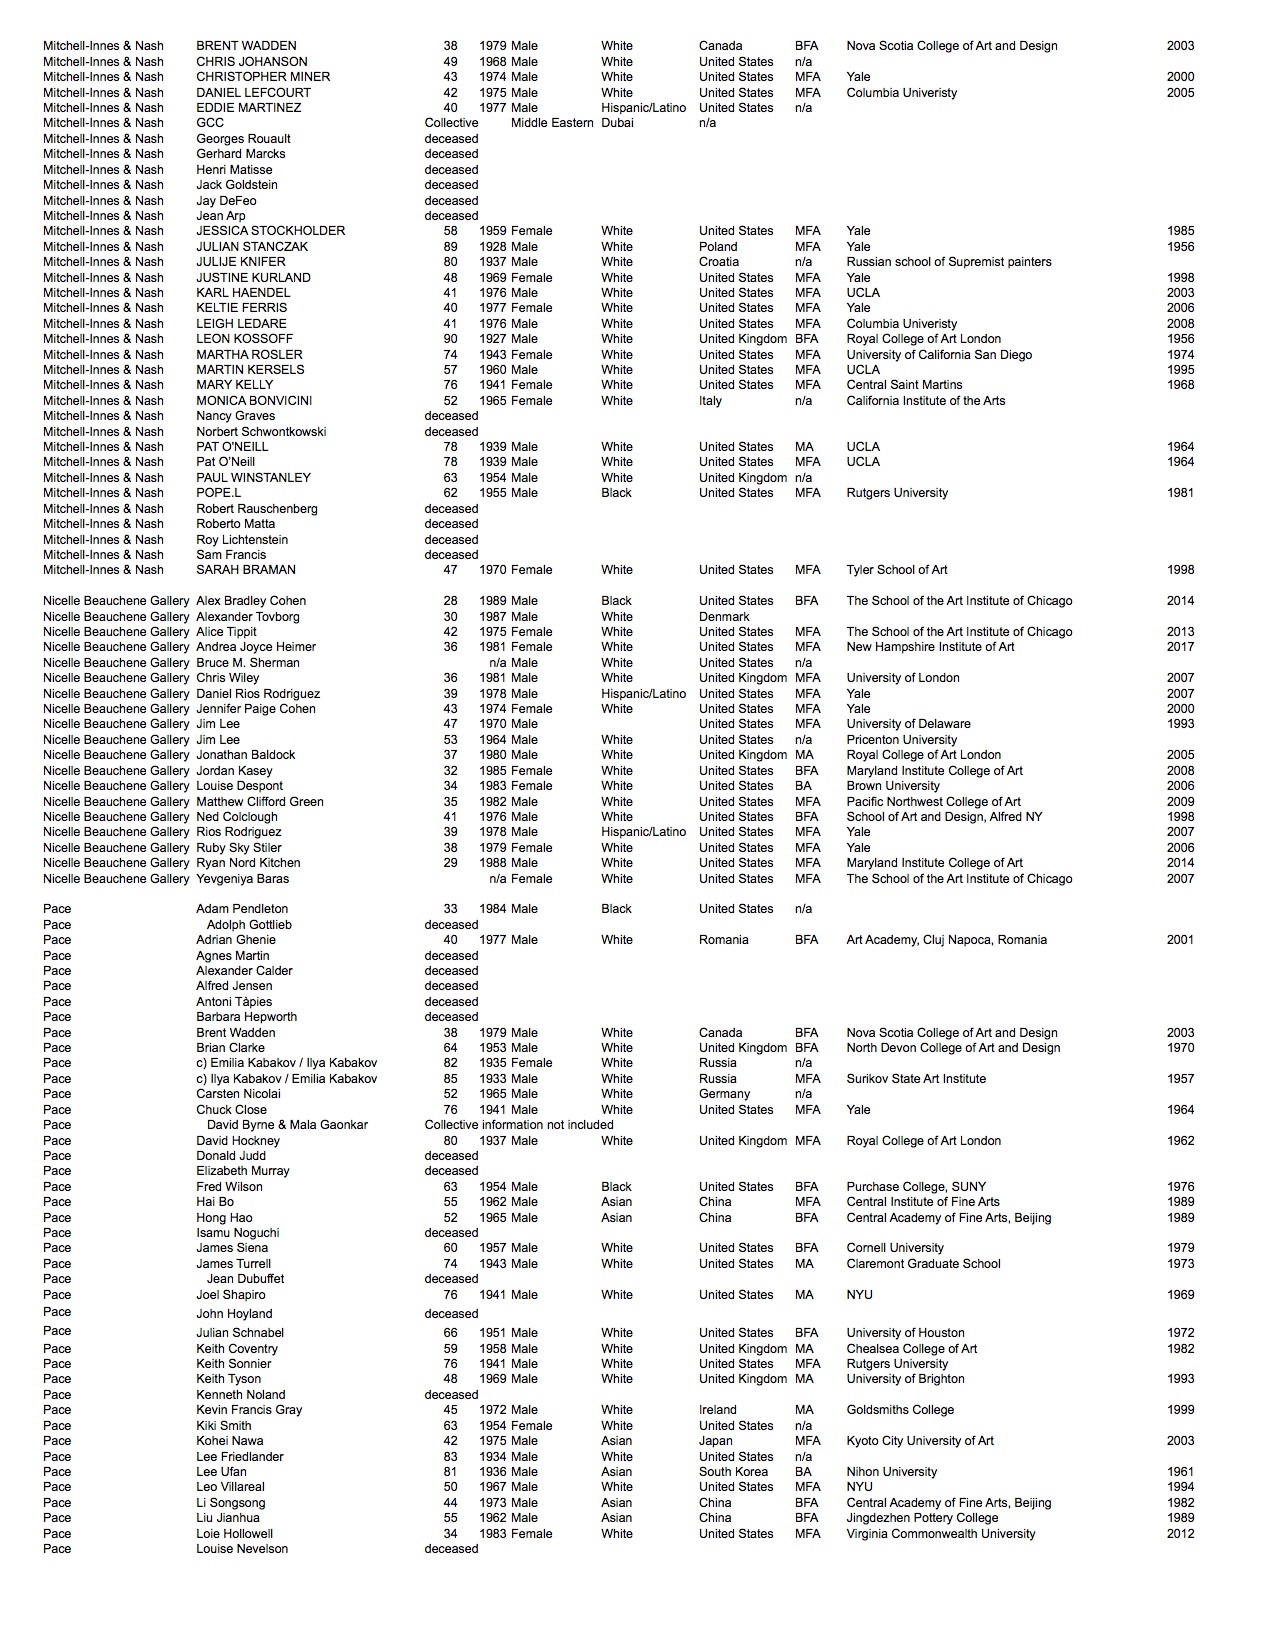
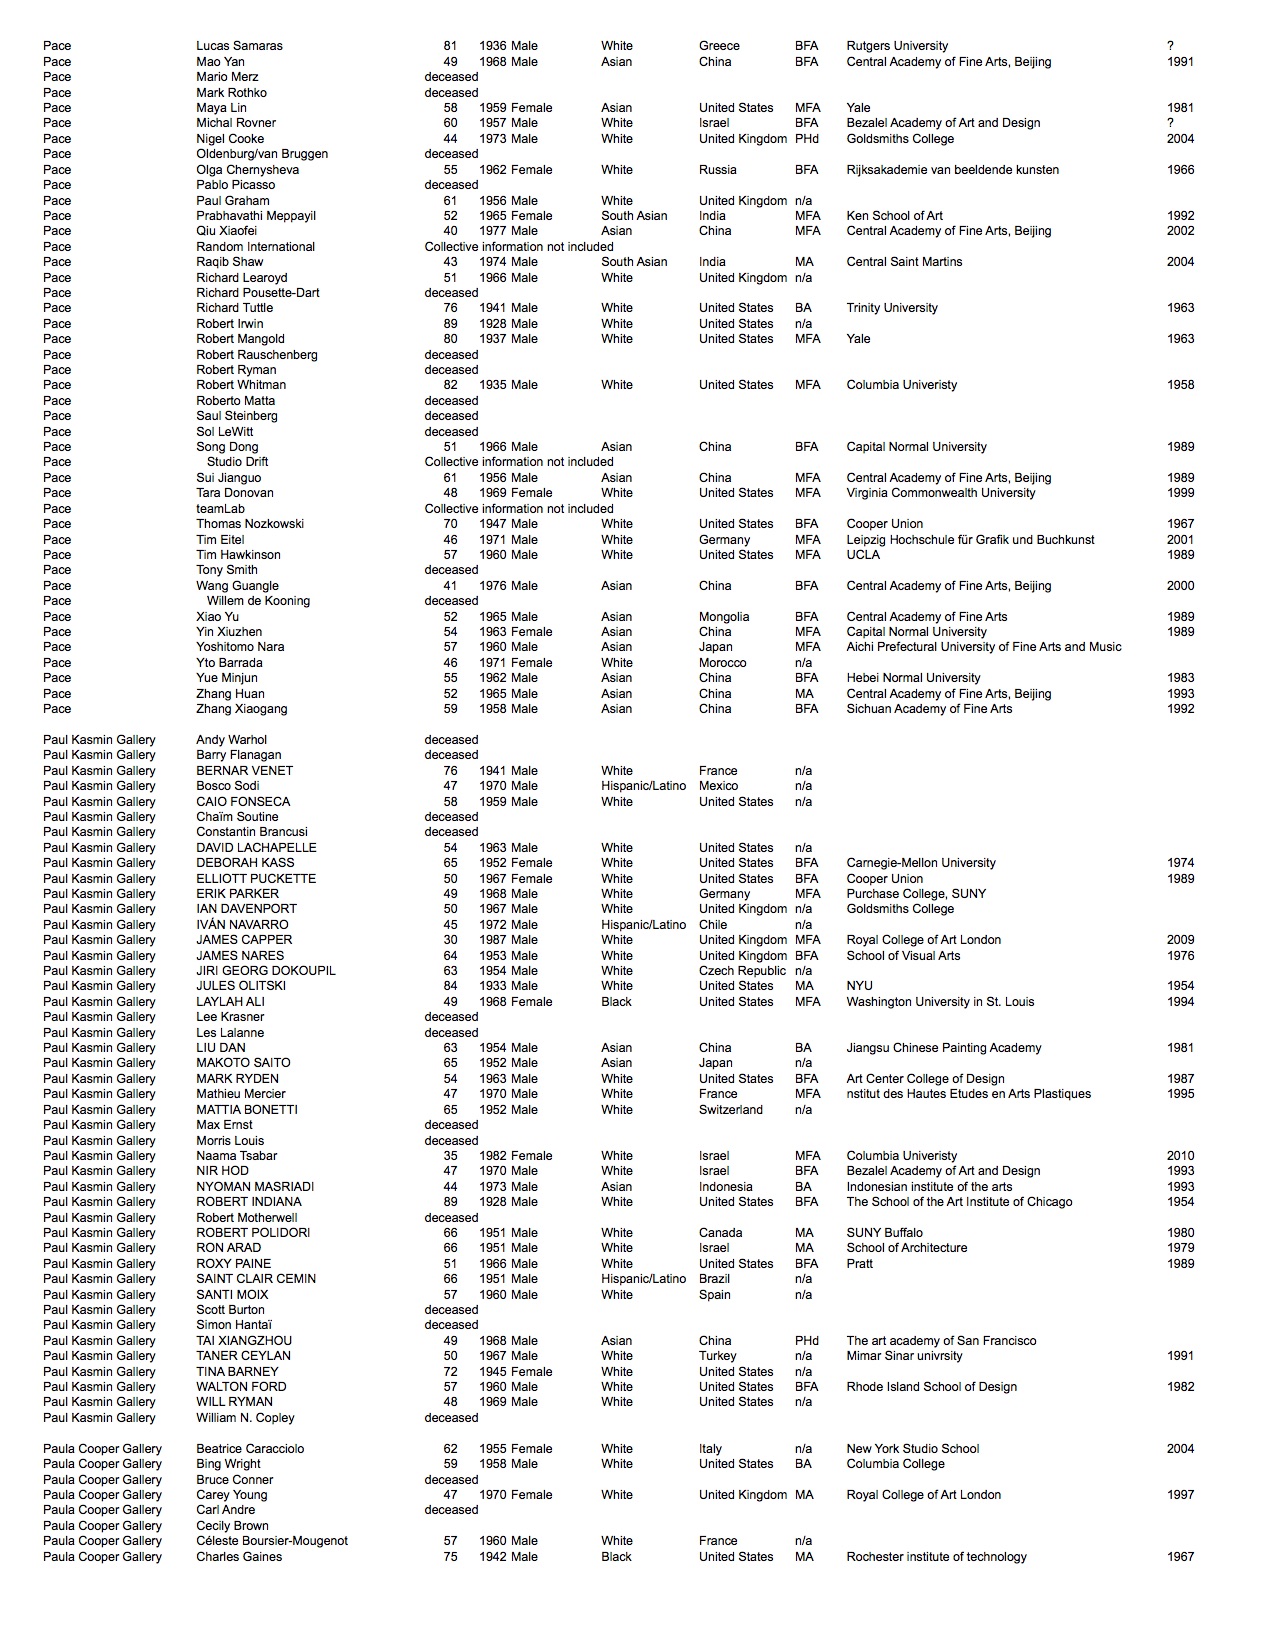
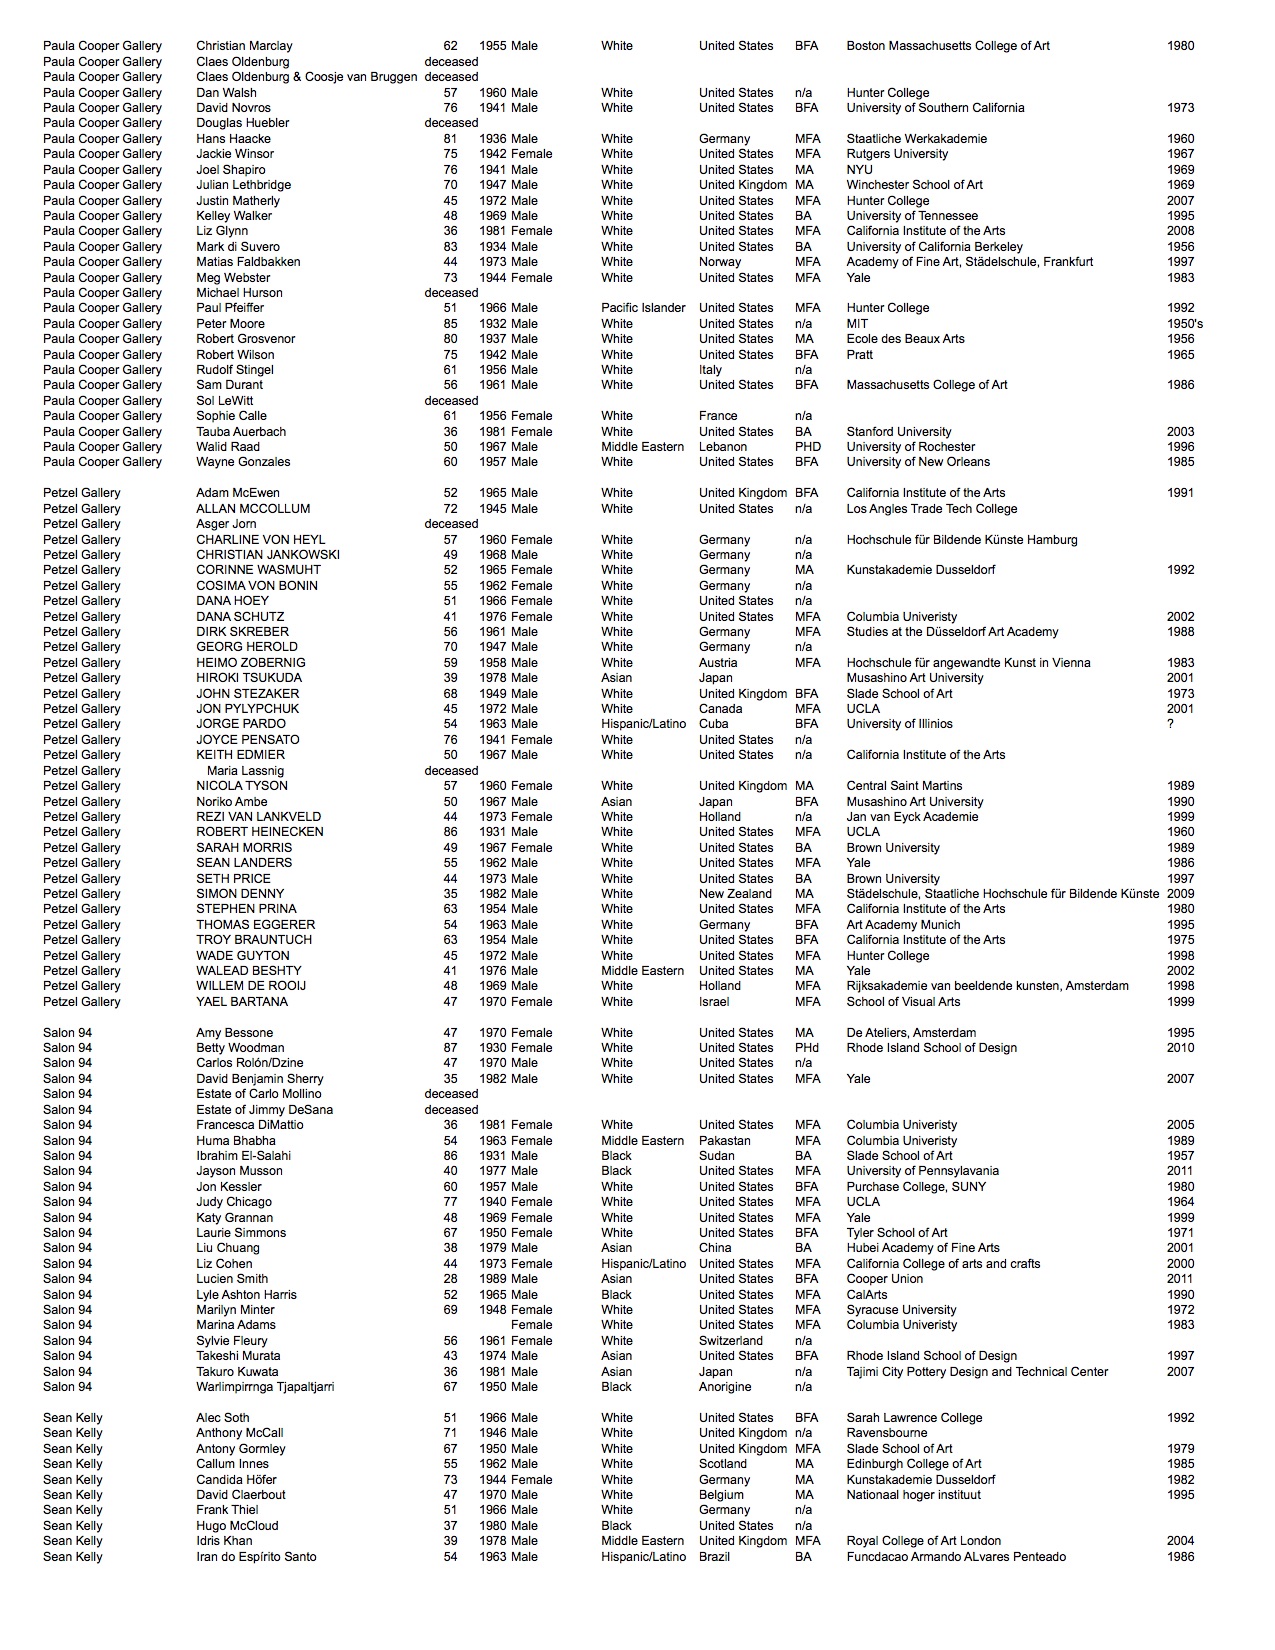
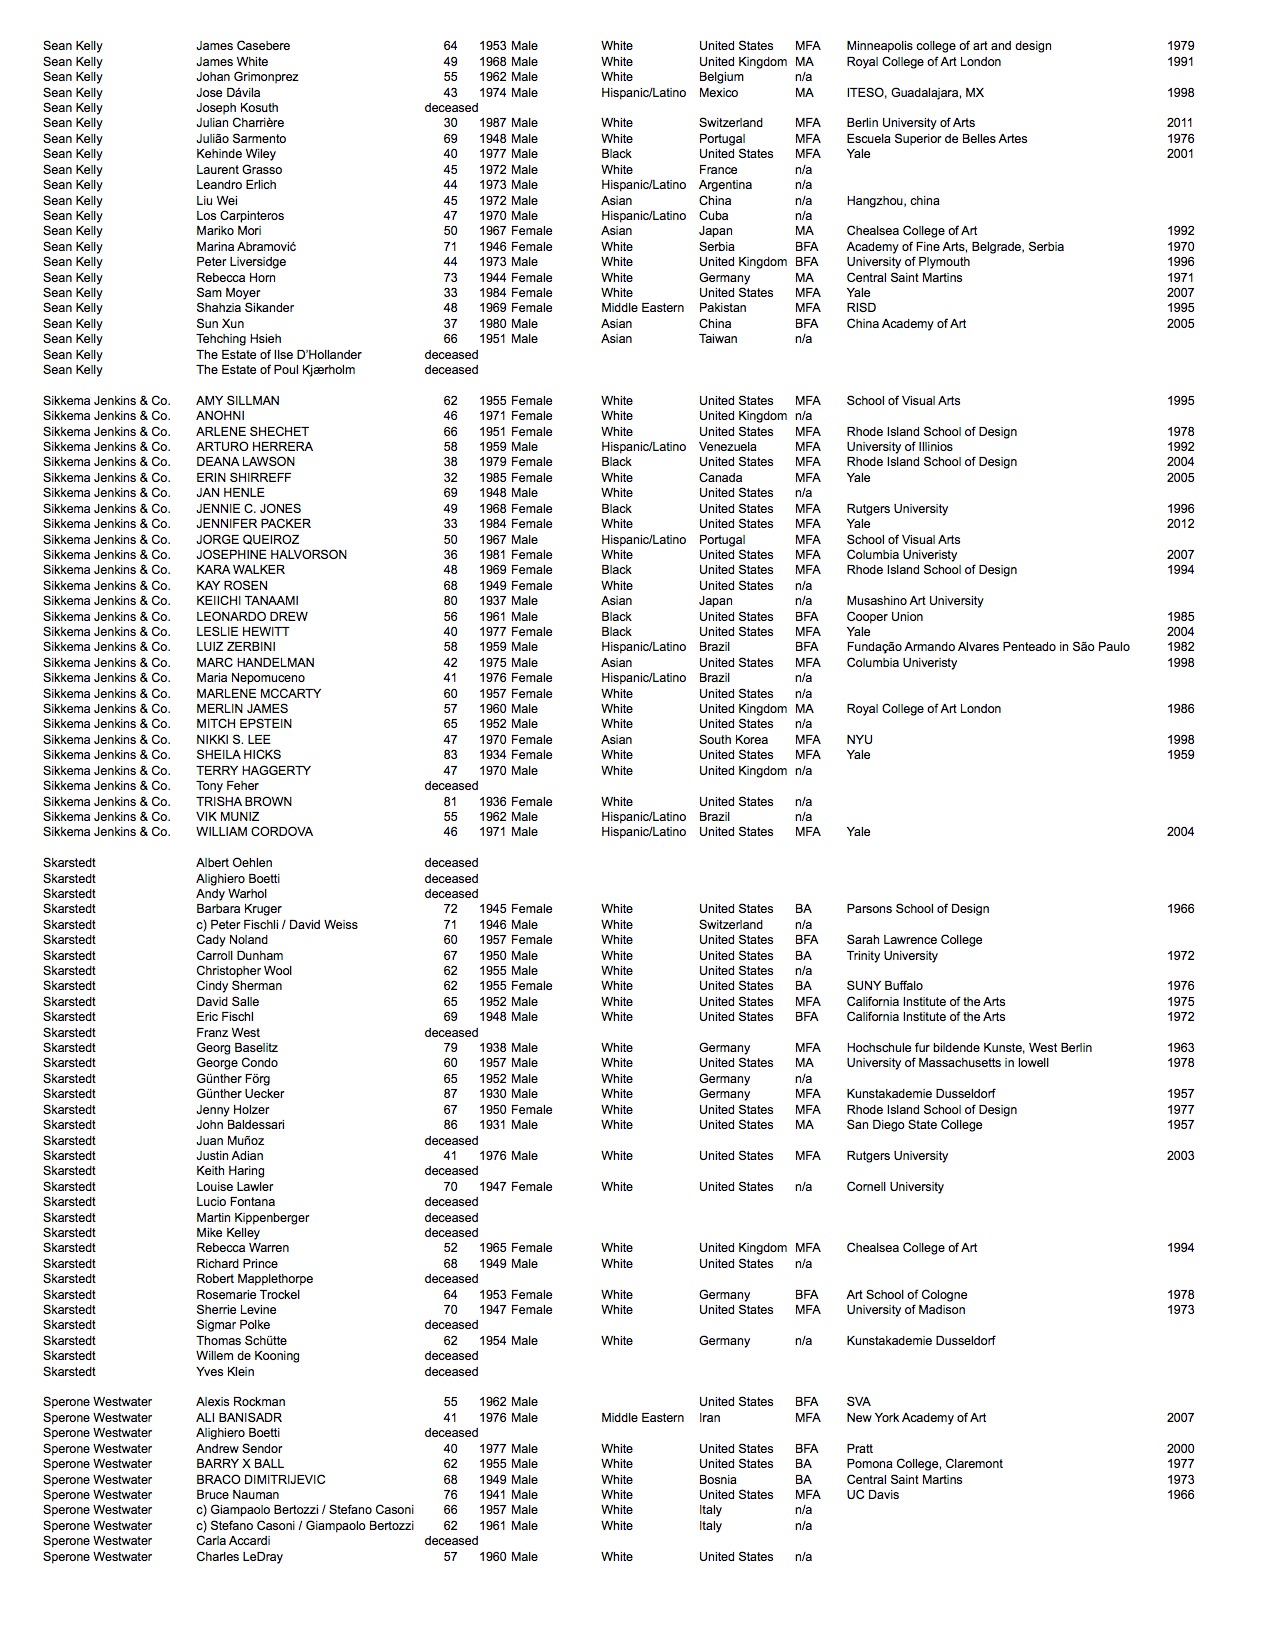
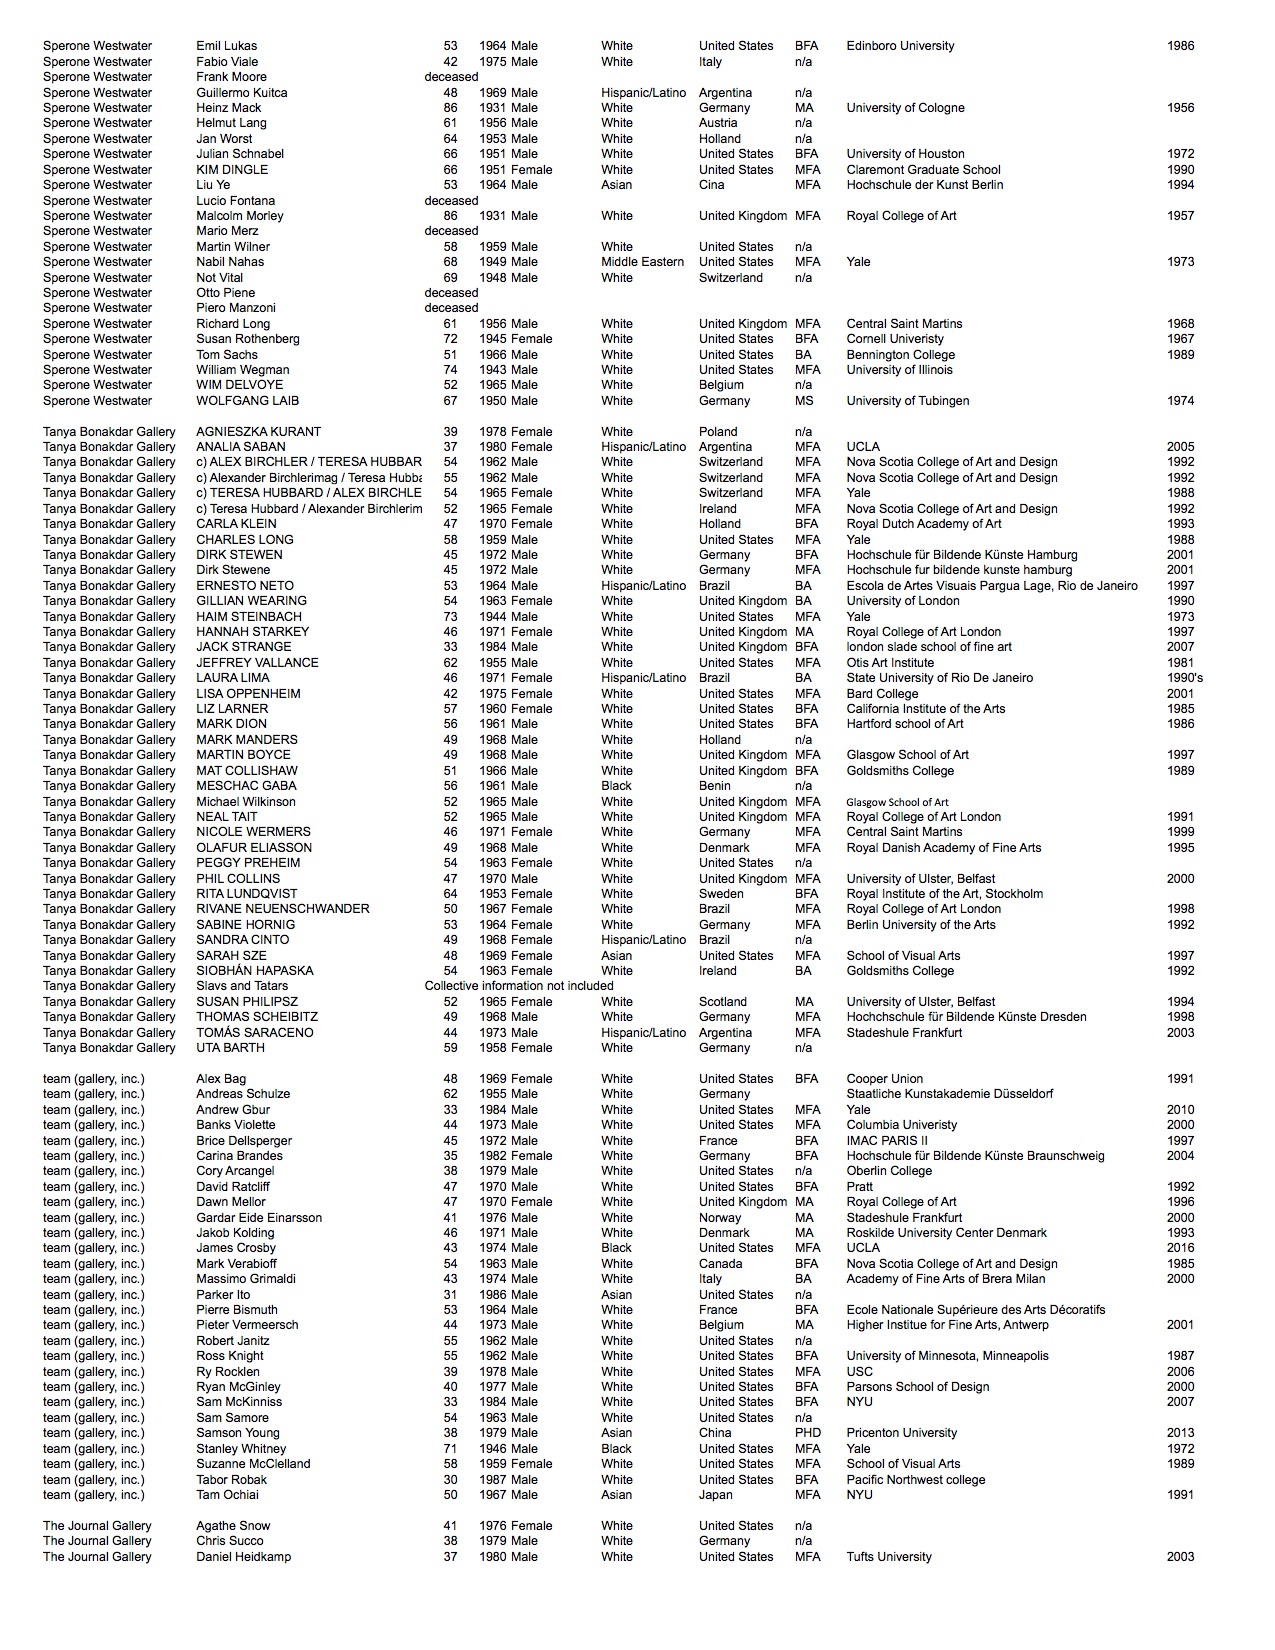
We built a database of 1300 artists represented at the top 45 commercial galleries in New York. We researched each artist noting their: Age, Race*, Nationality, Gender*, and Education (highest degree, institution, and date of graduation).
Special thanks to Guttman College and the students who assembled this data including our research assistant Kareem Smalls.
*Artists were not interviewed. Gender and race determination is not representative of how that artist self-identifies. When available, we looked at indicators used by publications (artist's writing, gallery statements, and press), but in the absence of this, race and gender were recorded based on how they were perceived by the reviewing researcher.
*Research methods and source data in the last section of the page.

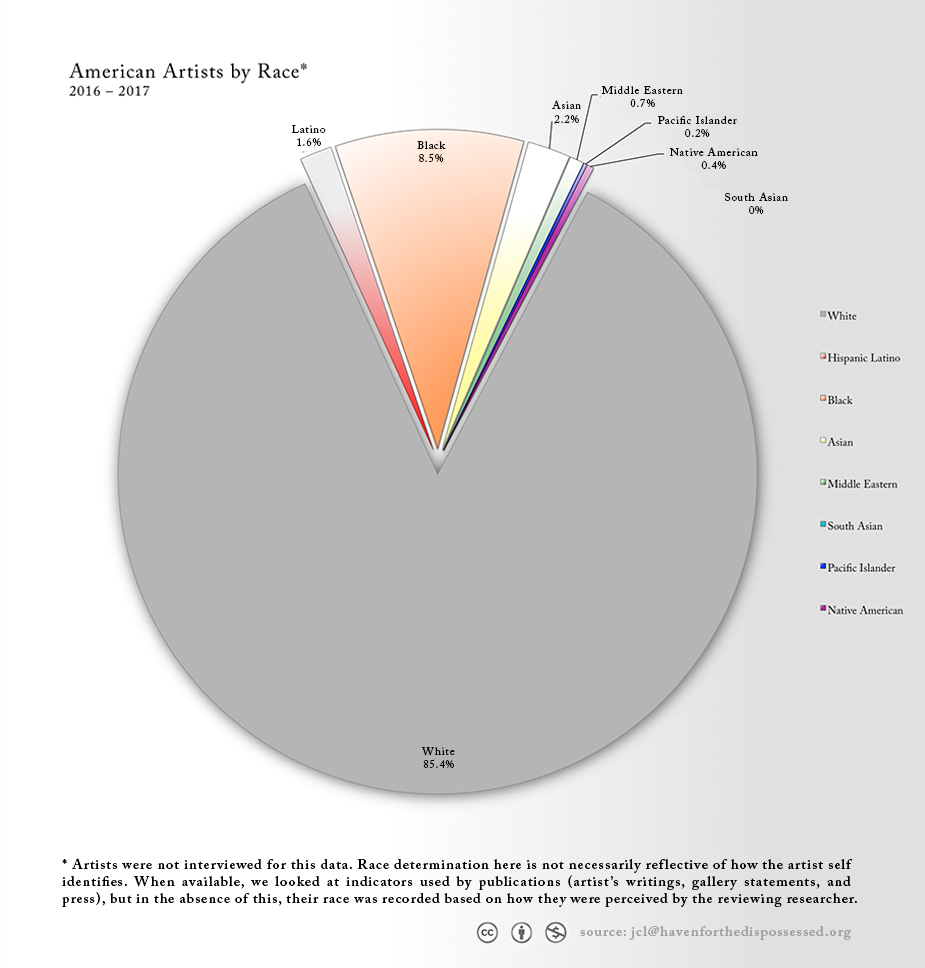
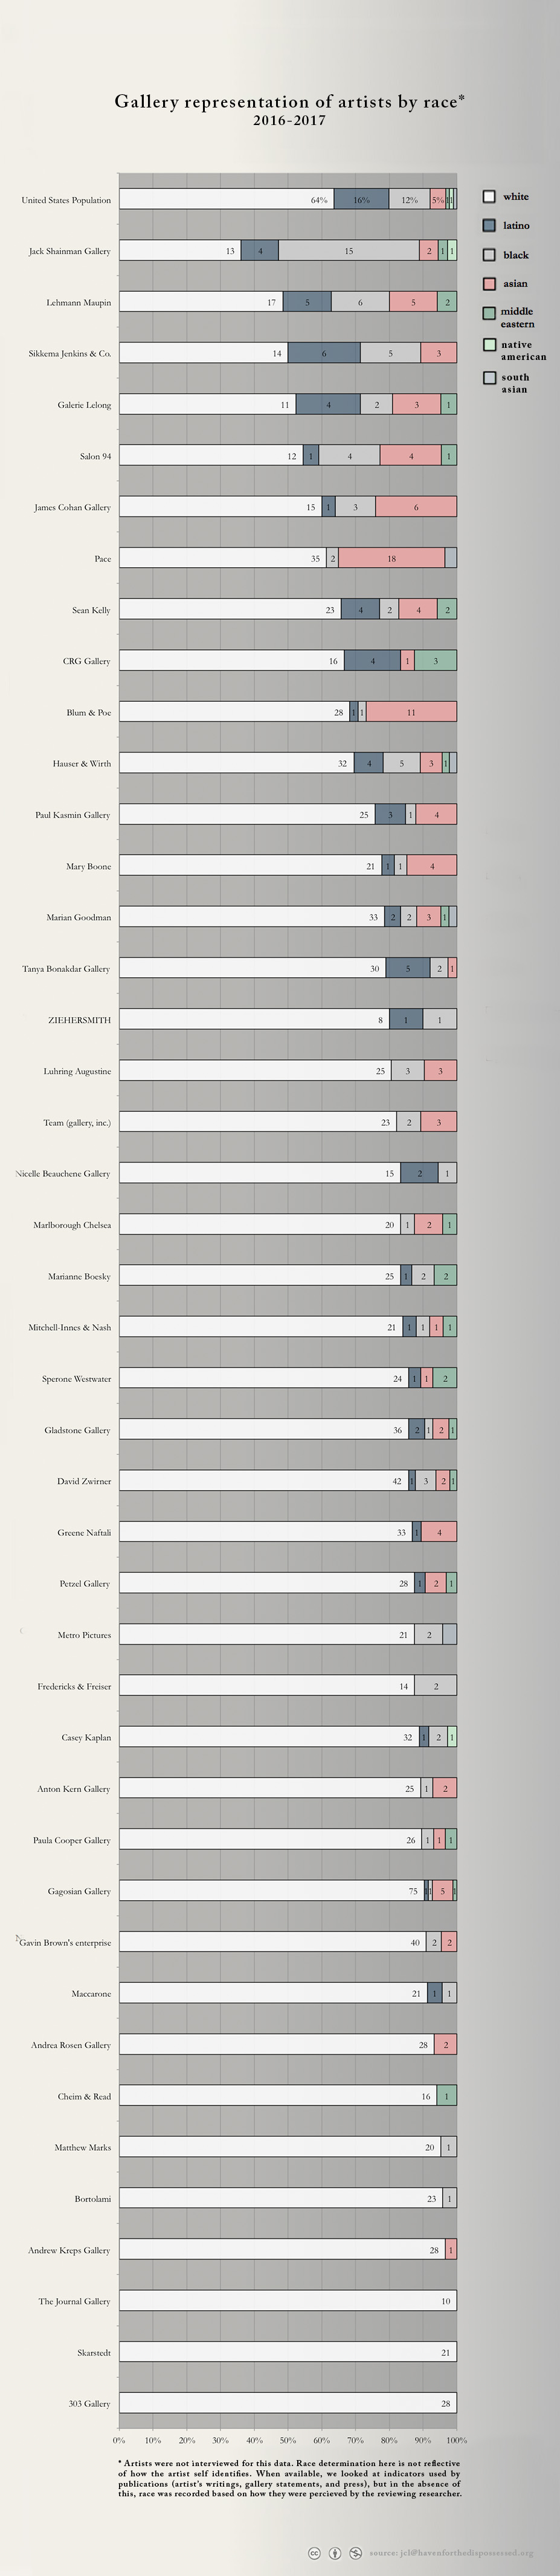
Comparisons to National (U.S) 2010 census data.**
White artists are represented at 85.4% compared to 61.6% of the population
Latino/Hispanic artists are represented at 1.6% compared to 16% of the population
Black artists are
represented at 8.5% compared to 12% of the population
Asian artist are represented at 2.2% compared to 5% of the population
Middle Eastern artists are represented at 0.7% compared to 1% of the population
Pacific Islander artists are represented at 0.2% compared to 0.5% of the population
South Asian artists are not represented 0% compared to 1.3% of the population
Native American artist are represented 0.4% compared to
1% of the population
https://www.census.gov/quickfacts/table/PST045216/00
*note we are using the 2010 census data for comparison, not the 2015 ACS estimates.
**
White is listed at on the census as "White alone, not Hispanic or Latino"
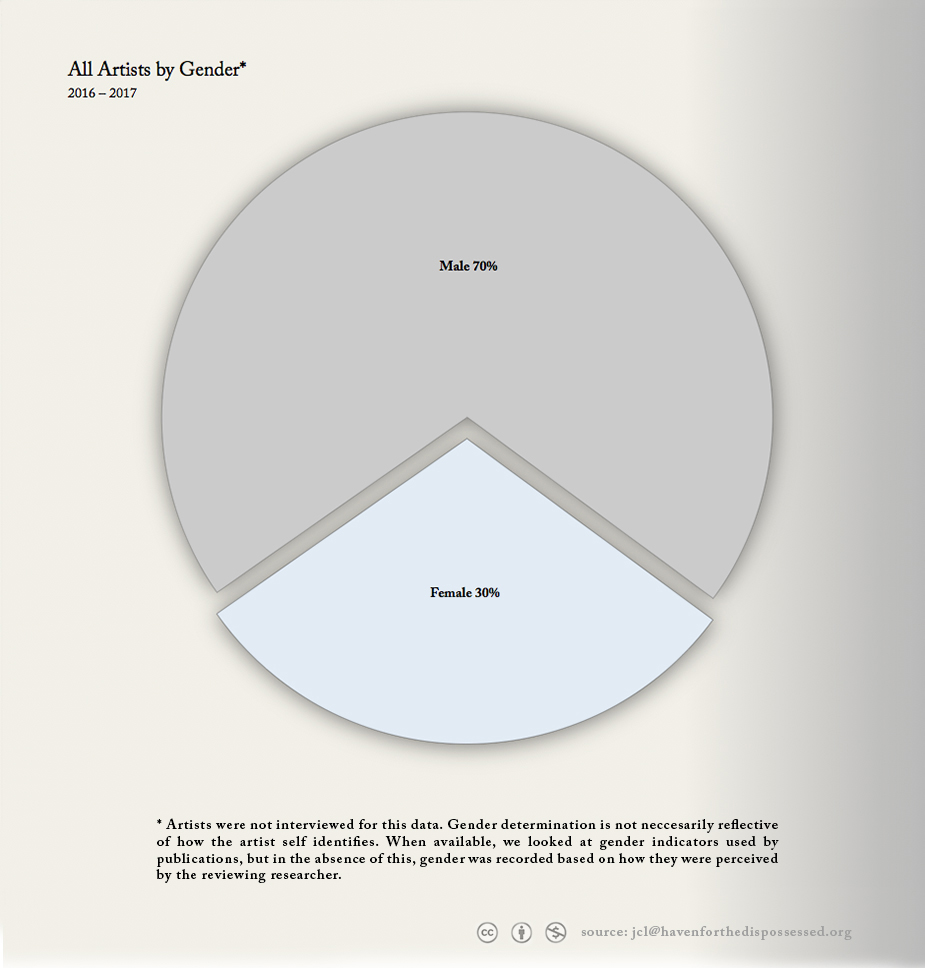
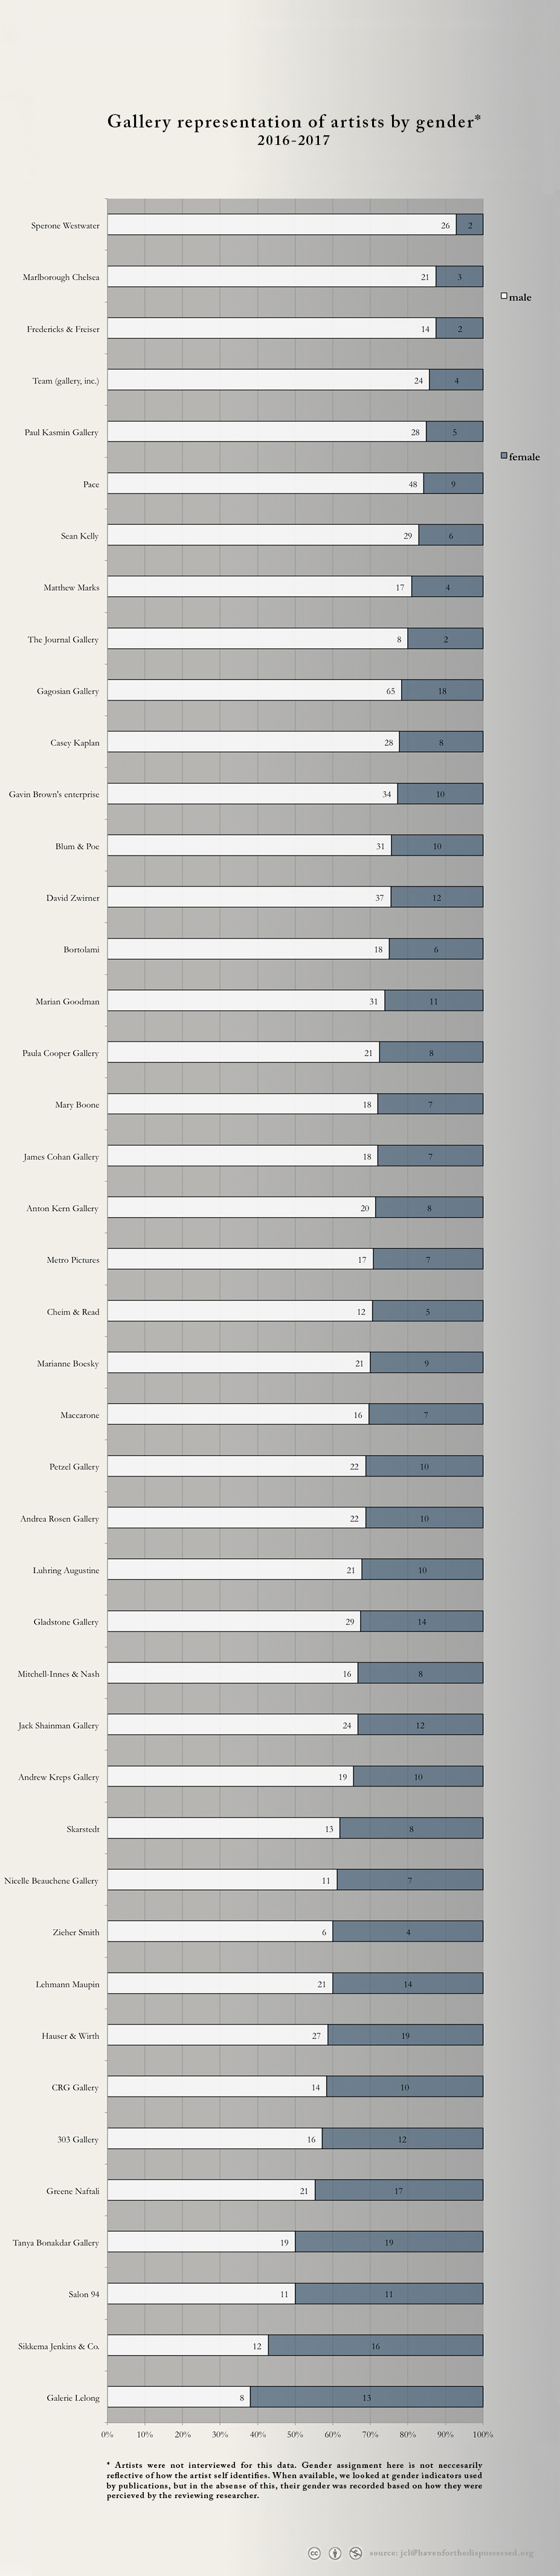
American artists as a group closely match the international representation by Gender.
American artists only: Men 68% ; Women 32%
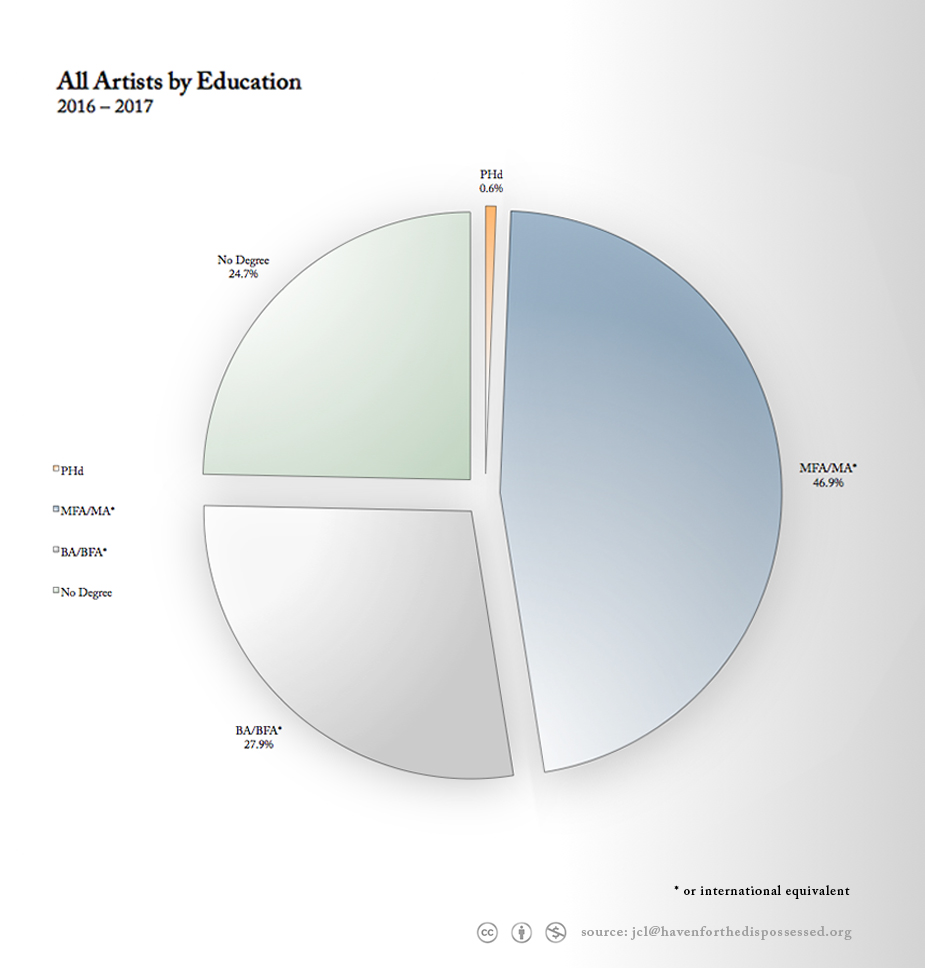
American artists as a group closely match the international distribution for education.
American artists only:
Phd: 0.4%
MFA/MA: 52.3%
BFA/BA: 30.7%
No Degree: 16.5%
Galleries
| 303 Gallery | Andrea Rosen | Andrew Kreps | Anton Kern | Blum & Poe | Bortolami |
| Casey Kaplan | Cheim & Read | CRG Gallery | David Zwirner | Fredericks & Freiser | Gagosian |
| Galerie Lelong | Gavin Brown | Gladstone | Greene Naftali | Hauser & Wirth | Jack Shainman |
| James Cohan | Journal Gallery | Lehmann Maupin | Luhring Augustine | Maccarone | Marian Goodman |
| Marlborough | Marriane Boesky | Mary Boone | Matthew Marks | Metro Pictures | Mitchell-Innes & Nash |
| Nicelle Beauchene | Pace Gallery | Paul Kasmin | Paula Cooper | Petzel | Salon 94 |
| Sean Kelly | Sikkema Jenkins | Skarstedt | Sperone Westwater | Tanya Bonakdar | Team Gallery |
| Zieher Smith |
Gallery rosters change frequently. The data listed is of the artists represented as of fall 2016. In the time since this project has concluded two of the galleries have permanently closed: Andrea Rosen Gallery and CRG.
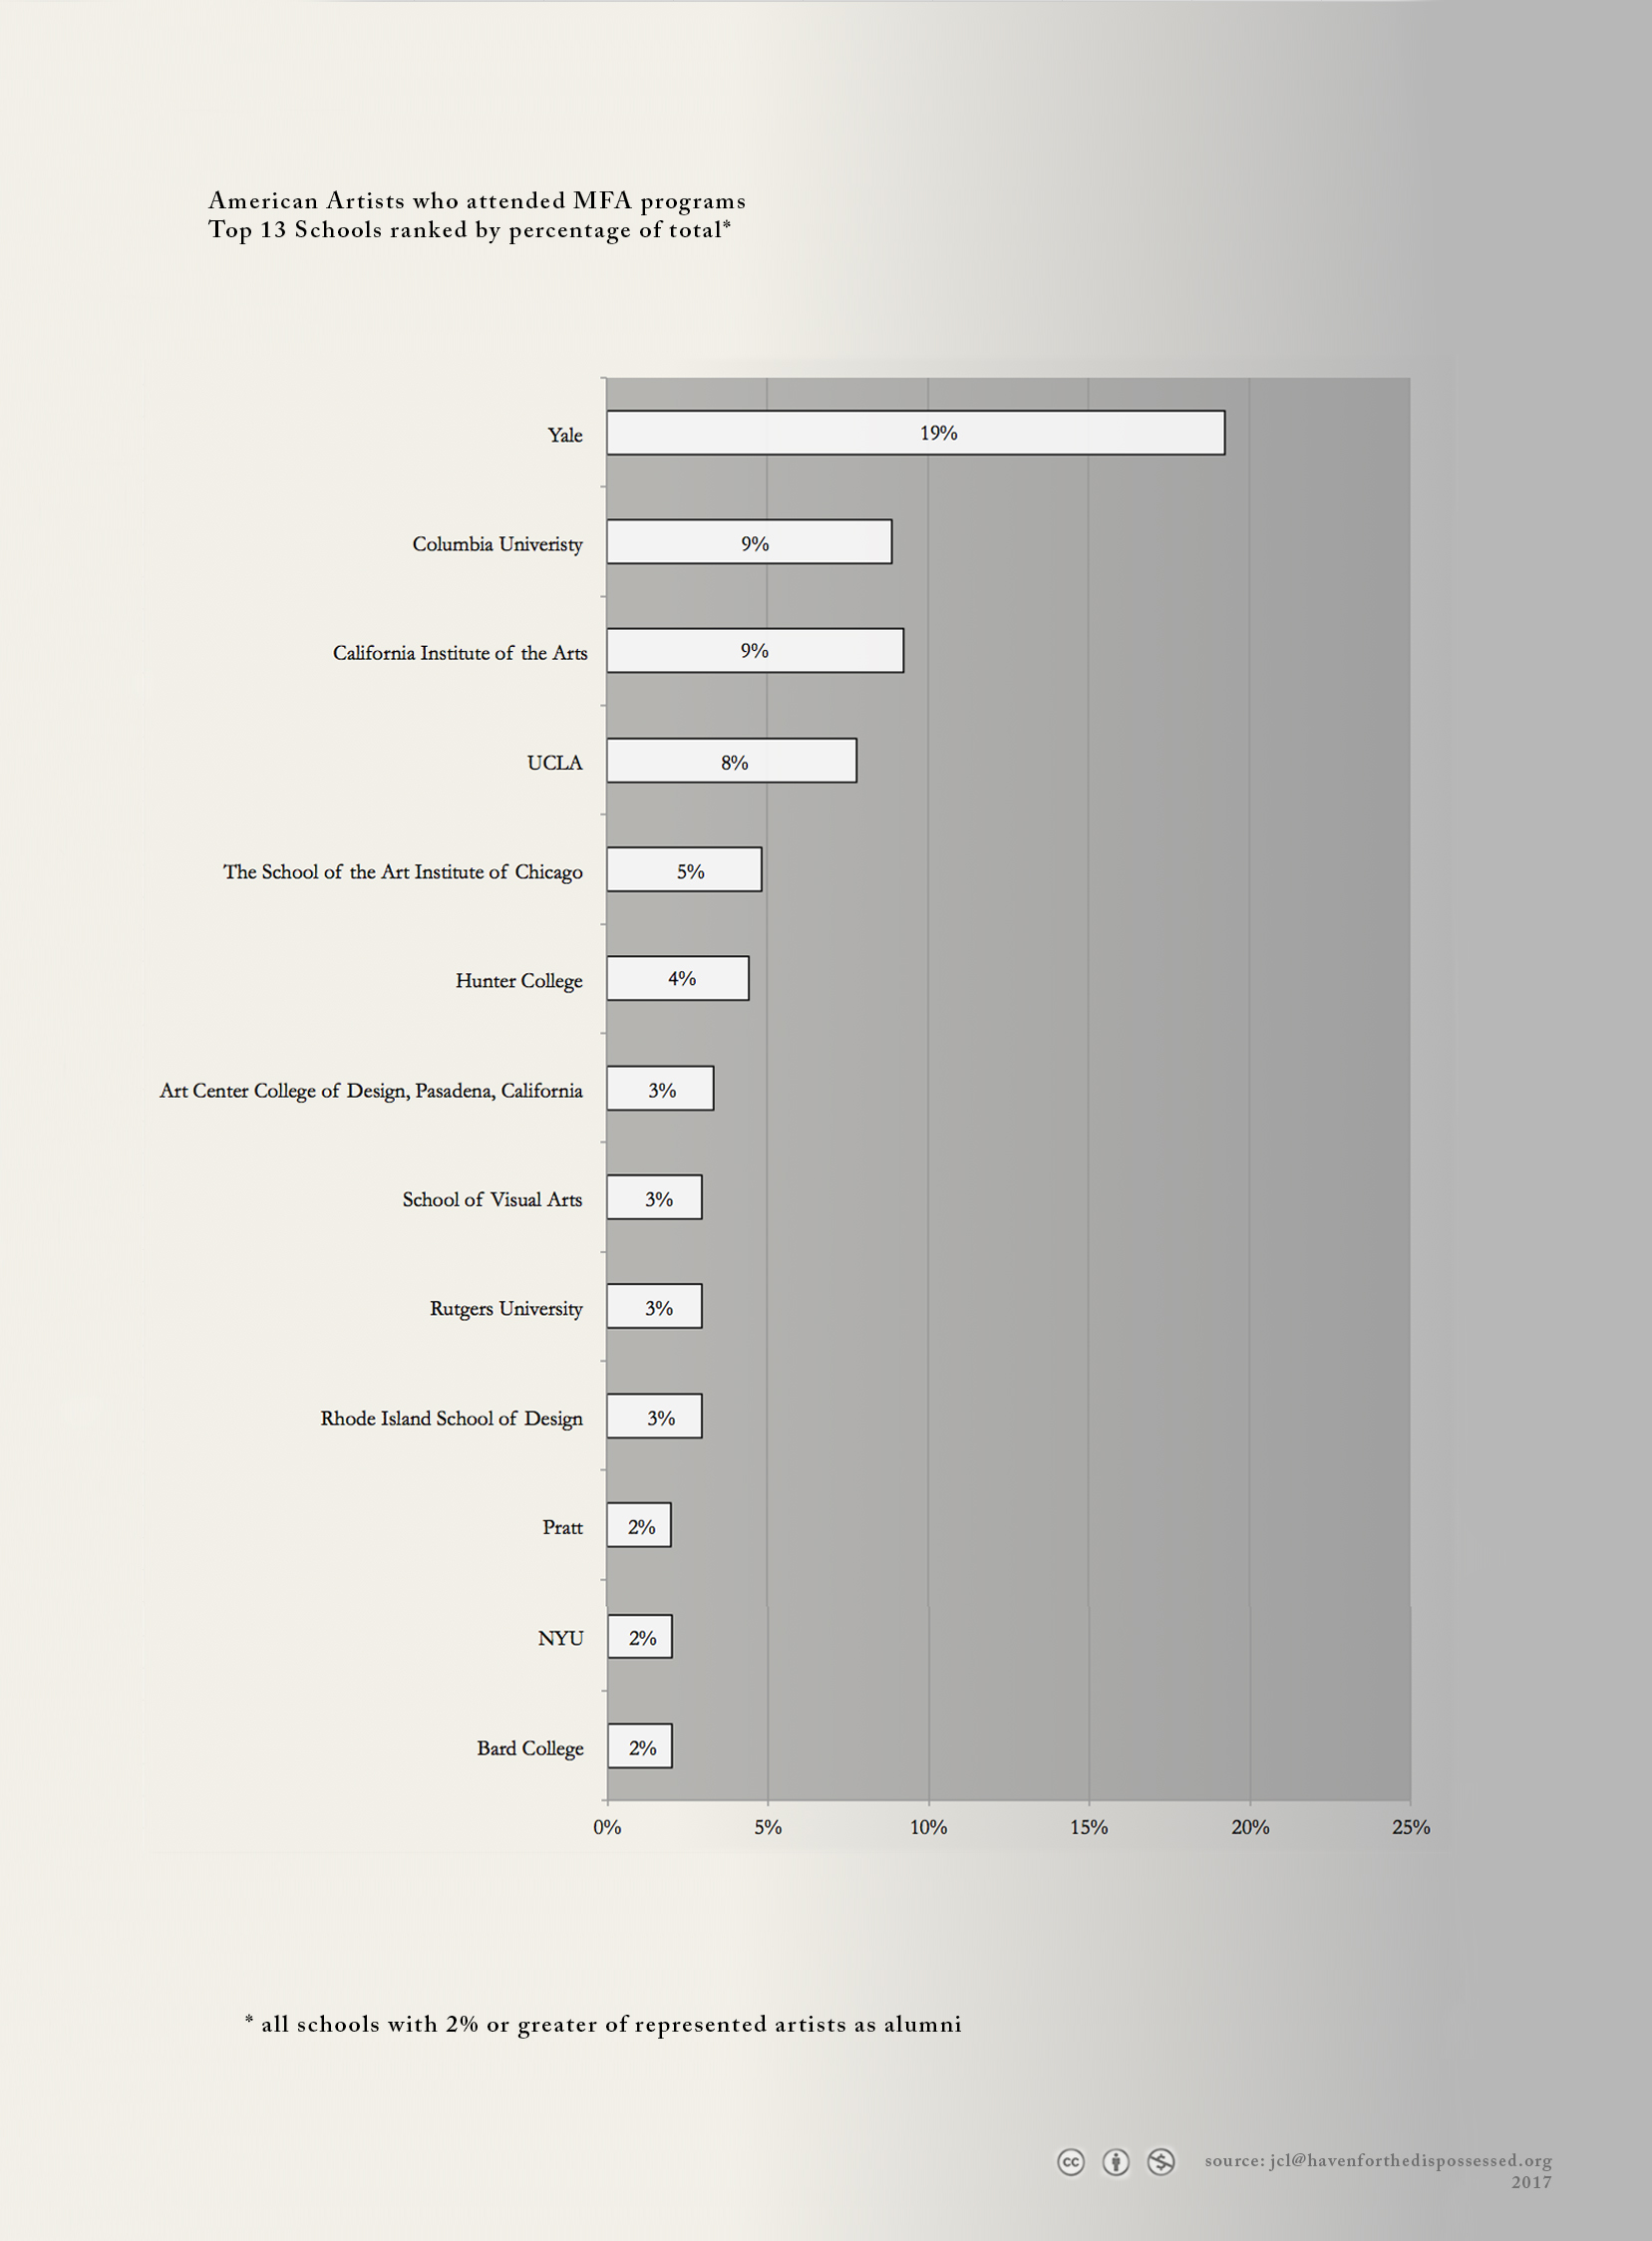
Ranked Schools - Americans only
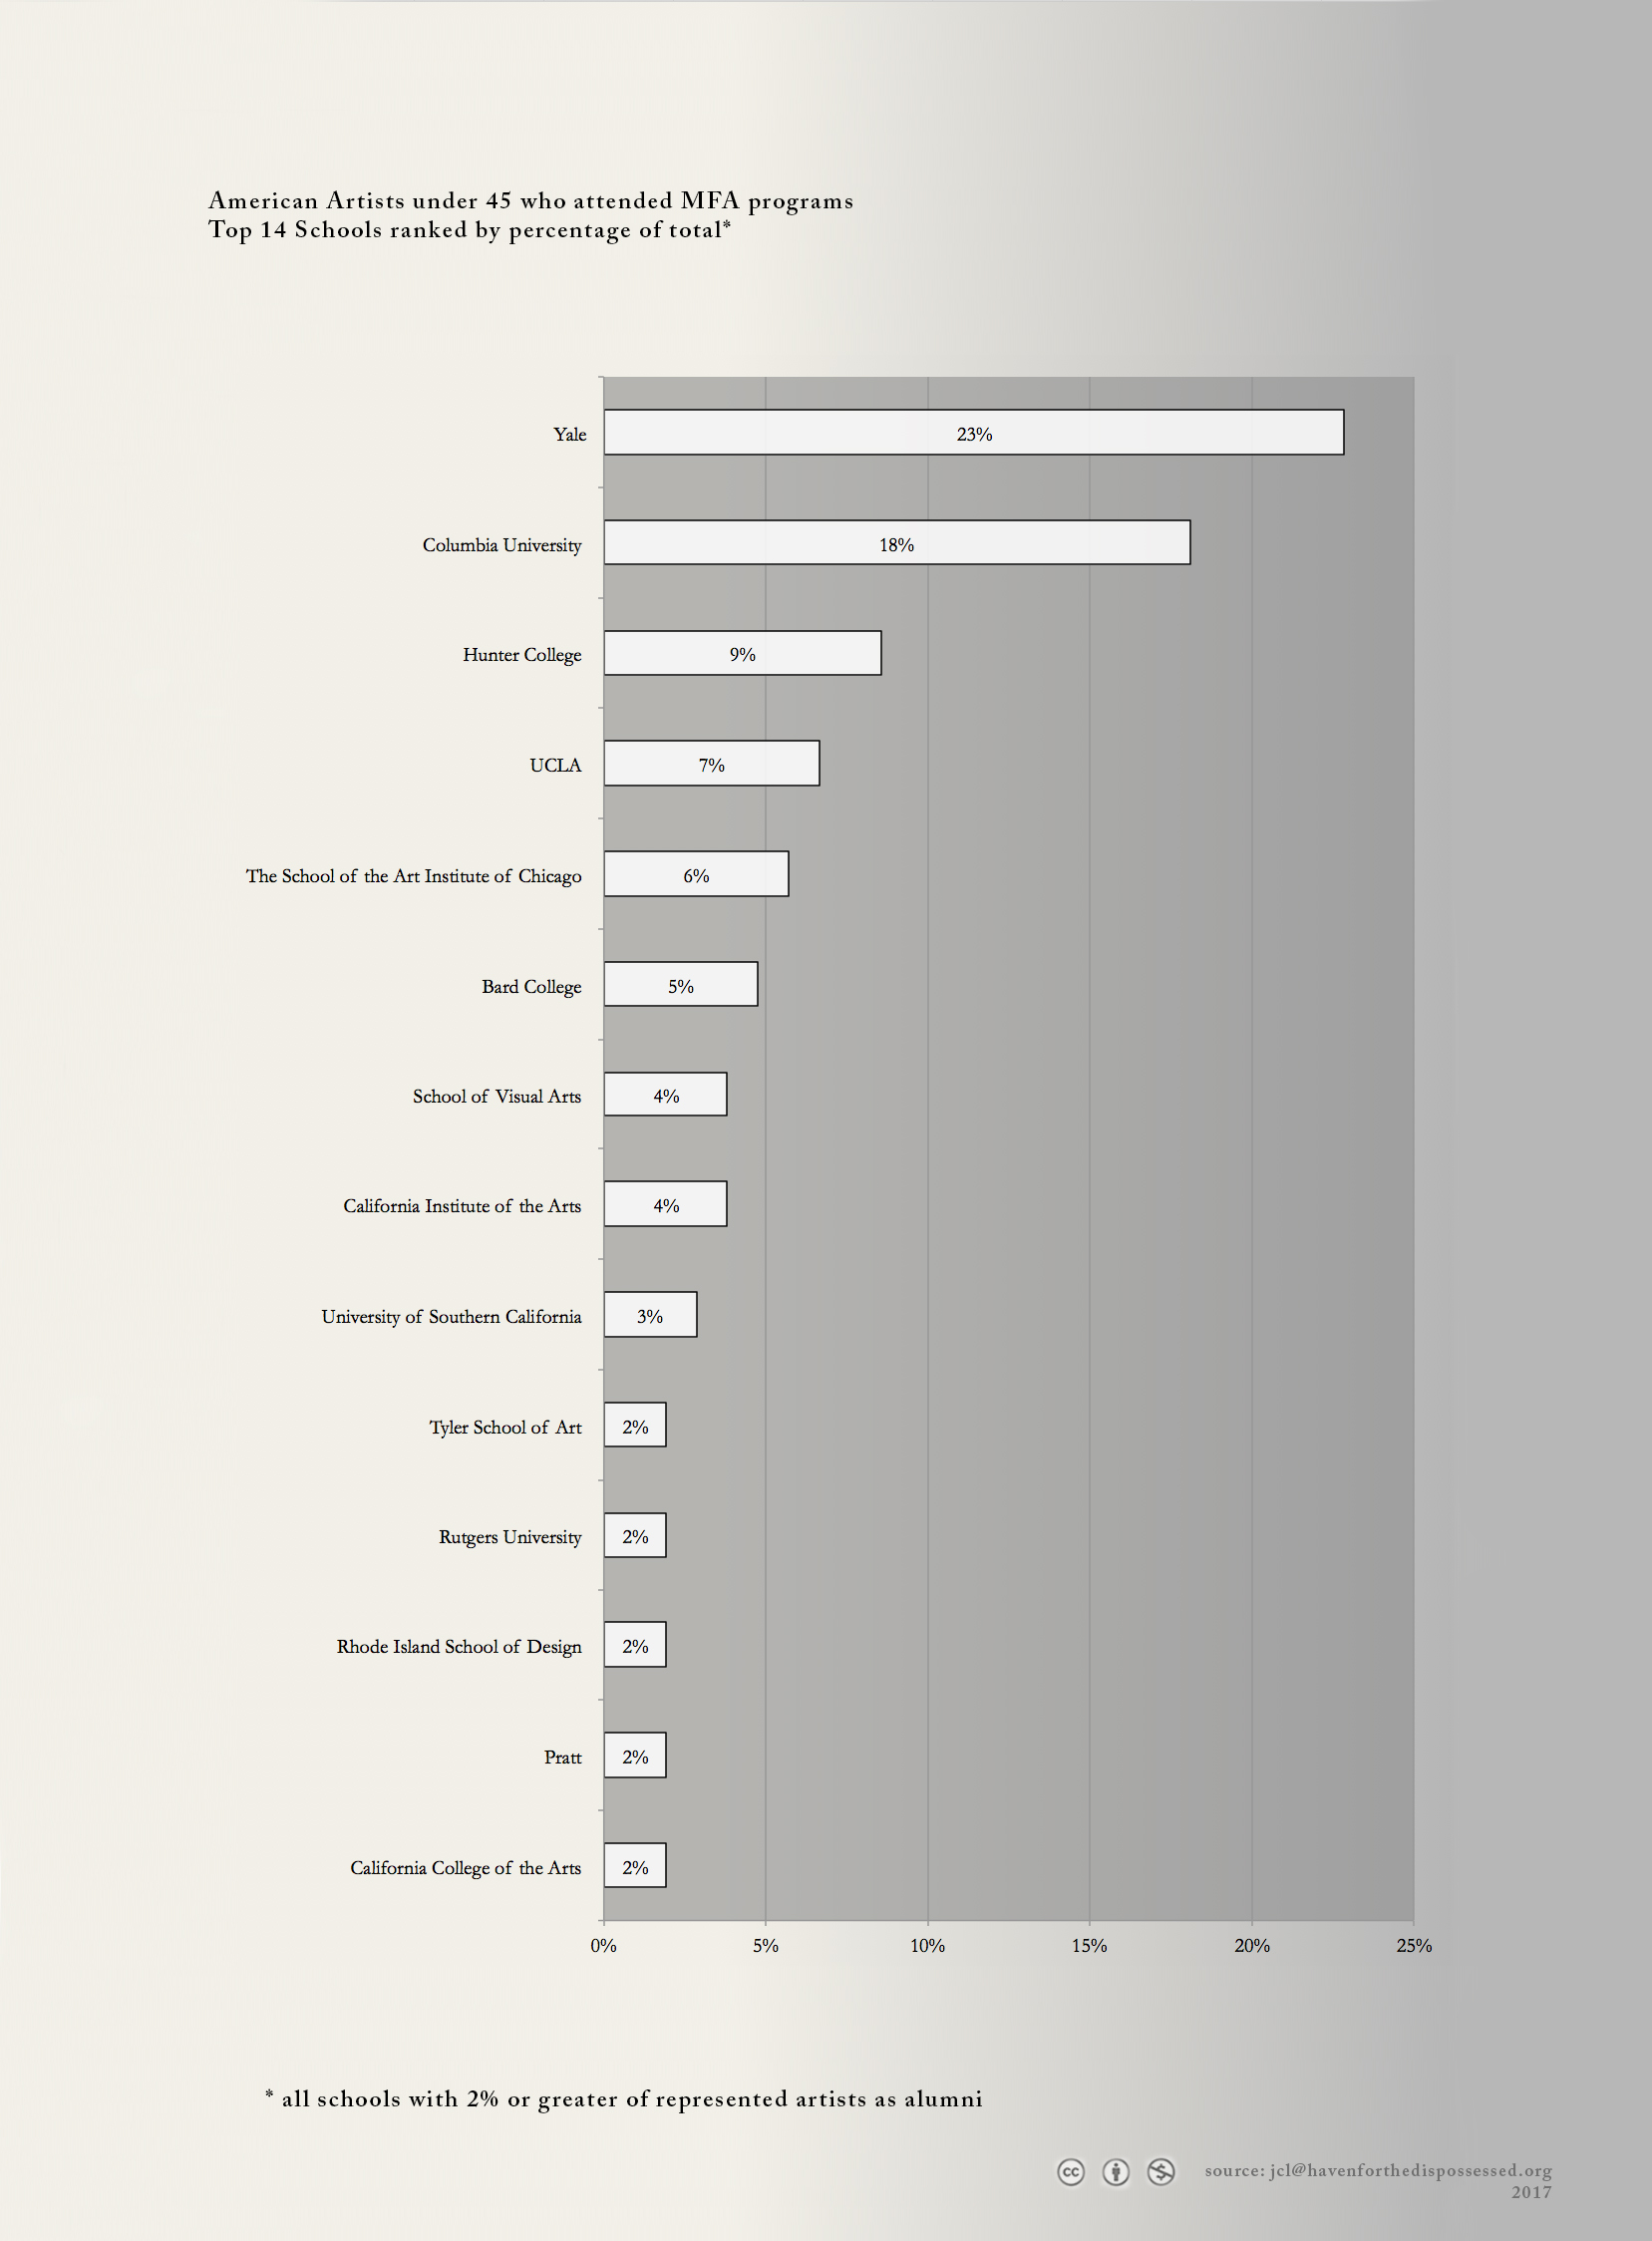
Ranked Schools - Americans Under 45
Methods -
We focused on these artists as representative of those in the best position to support their production via the primary art market. We looked only at living artists represented by a set of commercial art galleries that have a physical space in New York City and participate actively in the the major art fairs : Armory, Art Basel, Frieze, and NADA. Additionally, we reviewed several galleries that do not participate in art fairs, but have a historically strong position in the primary market.
We looked at each artist publicly represented by the galleries and recorded available biographical information: looking at age, nationality, highest level of education, where they attended, graduation year, their perceived gender*, and race*.
To determine race and gender we looked at how the artist has been written about by publications and the gallery. When that information was not available the reviewer used their best personal judgement based on indicators that stood out to them. For this reason we were not able to identify any of the artists as trans or non-gendered.
Identifying race is always complicated. Perceptions and determination of race varies widely by culture and geography and is commonly incongruous with the subject's self identification. The individual reviewers often looked at photographs of the artists to help make a determination by judging phenotypical indicators against their own understanding of racial signifiers. While it is important to acknowledge and give preference to a person's self identification - discrimination and representation are most commonly based on how race and gender are perceived by those with the power to discriminate and represent.
We generally used U.S. census categories for catagorizing race with the exception of Black Hispanic artists who we classified as Black and White Hispanic artists who we classified as Hispanic.
Our 26 reviewers are all full-time students at Guttman College CUNY in Manhattan. They come from a broad range of backgrounds and predominately self identify as Latino and Black. Many are immigrants from the Caribbean and Latin America. They nearly all received their primary education at public schools in New York City.
Press
Study Claims 80.5% of Artists Represented by NYC’s Top 45 Galleries Are White – Hyperallgeric
The Gray Market: What Art Basel Can Learn From a Flawed Study on Gallery Bias – Artnet
It’s Official, 80% of the Artists in NYC’s Top Galleries Are White – Artnet
New study reveals lack of diversity in NYC top art galleries – Crave
New York Artist Homogeny – Harpers Bazaar Arabia
*update June 3, 2017
Thank you for your corrections and contributions.
In the days since this site's launch generous members of the public have reviewed the source data and sent in corrections. Most were the result of clerical errors in data entry and several from misinterpretations on the part of the reviewer.
There have been 30 corrections made to date representing less than a 0.3% margin of error when looking at the total number of data fields entered. (99.7% accuracy).
I am committed to presenting this as accurately as possible. My apologies to anyone who was misidentified or gallery who feels misrepresented.
This project is published online with the hopes that the public will collaborate by crowdsourcing any fact-checking needed. I am thrilled that so many have written in - a special thank you to all who have participated.
Your comments matter.
I am updating the data and visualizations as needed. Please let me know what you find – jcl
Copyright and licencing information
All data and visualizations are under Creative Commons licensing allowing for all non-commercial applications citing the source. Adaptations permited by request.
Source data and high resolution data visualization available by request.
All inquiries should be sent to jcl@havenforthedispossessed.org
Source Data -
Please let us know if you believe an entry to be factually incorrect. We will review and correct the data where applicable.
Please contact us along with your source at jcl@havenforthedispossessed.org